Download
1 / 7
70 likes | 275 Vues
Titanic disaster occurred 100 years ago on April 15, 1912, killing about 1500 passengers and crew members. The fateful incidents still compel the researchers and analysts to understand what could have led to the survival of some passengers and demise of the others. With the use of machine learning methods and a dataset consisting of 891 rows in the train set and 418 rows in the test set, we attempt to determine the correlation between factors such as age, sex, passenger class, fare etc. to the chance of survival of the passengers. These factors may or may not have impacted the survival rates of the passengers. In this research paper, we use various machine learning algorithms namely Logistic Regression, Nau00c3u00afve Bayes, Decision Tree, Random Forest to predict the survival of passengers. In particular, we attempt to compare these algorithms. Dr. Prabha Shreeraj Nair "Analyzing Titanic Disaster using Machine Learning Algorithms" Published in International Journal of Trend in Scientific Research and Development (ijtsrd), ISSN: 2456-6470, Volume-2 | Issue-1 , December 2017, URL: https://www.ijtsrd.com/papers/ijtsrd7003.pdf Paper URL: http://www.ijtsrd.com/engineering/computer-engineering/7003/analyzing-titanic-disaster-using-machine-learning-algorithms/dr-prabha-shreeraj-nair<br>

E N D
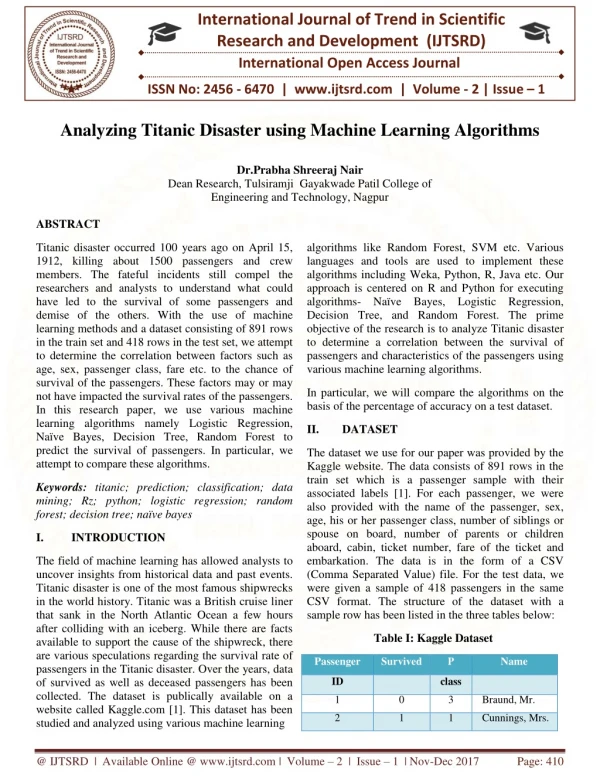
International Journal of Trend in Scientific Research and Development (IJTSRD) International Open Access Journal ISSN No: 2456 - 6470 | www.ijtsrd.com | Volume - 2 | Issue – 1 Analyzing Titanic Disaster using Machine Learning Algorithms Dr.Prabha Shreeraj Nair Dean Research, Tulsiramji Gayakwade Patil College of Engineering and Technology, Nagpur ABSTRACT Titanic disaster occurred 100 years ago on April 15, 1912, killing about 1500 passengers and crew members. The fateful incidents still compel the researchers and analysts to understand what could have led to the survival of some passengers and demise of the others. With the use of machine learning methods and a dataset consisting of 891 rows in the train set and 418 rows in the test set, we attempt to determine the correlation between factors such as age, sex, passenger class, fare etc. to the chance of survival of the passengers. These factors may or may not have impacted the survival rates of the passengers. In this research paper, we use various machine learning algorithms namely Logistic Regression, Naïve Bayes, Decision Tree, Random Forest to predict the survival of passengers. In particular, we attempt to compare these algorithms. algorithms like Random Forest, SVM etc. Various languages and tools are used to implement these algorithms including Weka, Python, R, Java etc. Our approach is centered on R and Python for executing algorithms- Naïve Bayes, Logistic Regression, Decision Tree, and Random Forest. The prime objective of the research is to analyze Titanic disaster to determine a correlation between the survival of passengers and characteristics of the passengers using various machine learning algorithms. In particular, we will compare the algorithms on the basis of the percentage of accuracy on a test dataset. II. DATASET The dataset we use for our paper was provided by the Kaggle website. The data consists of 891 rows in the train set which is a passenger sample with their associated labels [1]. For each passenger, we were also provided with the name of the passenger, sex, age, his or her passenger class, number of siblings or spouse on board, number of parents or children aboard, cabin, ticket number, fare of the ticket and embarkation. The data is in the form of a CSV (Comma Separated Value) file. For the test data, we were given a sample of 418 passengers in the same CSV format. The structure of the dataset with a sample row has been listed in the three tables below: Keywords: titanic; prediction; classification; data mining; Rz; python; logistic regression; random forest; decision tree;naïve bayes I. INTRODUCTION The field of machine learning has allowed analysts to uncover insights from historical data and past events. Titanic disaster is one of the most famous shipwrecks in the world history. Titanic was a British cruise liner that sank in the North Atlantic Ocean a few hours after colliding with an iceberg. While there are facts available to support the cause of the shipwreck, there are various speculations regarding the survival rate of passengers in the Titanic disaster. Over the years, data of survived as well as deceased passengers has been collected. The dataset is publically available on a website called Kaggle.com [1]. This dataset has been studied and analyzed using various machine learning Table I: Kaggle Dataset Passenger Survived P Name ID class 1 0 3 Braund, Mr. 2 1 1 Cunnings, Mrs. @ IJTSRD | Available Online @ www.ijtsrd.com | Volume – 2 | Issue – 1 | Nov-Dec 2017 Page: 410
International Journal of Trend in Scientific Research and Development (IJTSRD) ISSN: 2456-6470 TABLE II: KAGGLE DATASET (CONTD.) Sex Age Sib Sp Parch Ticket Parch Ticket male 22 1 0 A/521171 female 38 1 0 PC17599 TABLE II: KAGGLE DATASET (CONTD.) Fare Cabin Embarked 7.25 S Fig. 1 Age plot 71.2833 C85 C Similarly, we plotted a graph (Figure 2) and performed some calculations for the sex attribute and found out that the survival rate of the female is 25.67% higher to that of the male. Similarly, we explored each of the attribute to extract those attributes or features which we will use later for prediction. We also explored the dataset to determine the number of people survived vs. number of people who could not survive. From the histogram it is clear that the number of people who survived is less than the number of people who could not survive. The survival histogram is shown in Figure 3. TABLE IV: ATTRIBUTES IN TRAINING DATASET Attributes PassengerID Description Identification no. of the Passengers. Passenger class ( 1, 2 or 3) Name of the passengers Gender of the passengers ( male or female) Age of the passenger Number of siblings or spouse on the ship Number of parents or children on the ship Ticket number Price of the ticket Cabin number of the passenger Port of embarkation (Cherbourg, Queenstown or Southampton) Target variable (values 0 for perished and 1 for survived) Pclass Name Sex Age SibSp Parch Ticket Fare Cabin Embarked Survived Before building a model, we explored the dataset to determine what all factors or attributes can prove beneficial while creating the classifier for prediction. We started with few X-Y generic plots to get an overall idea for each attribute. Few generic plots have been shown below. From the age plot in Figure 1 we came to a conclusion that maximum or majority of the passengers belonged to the age group of 20-40. Fig. 2 Sex bar plot @ IJTSRD | Available Online @ www.ijtsrd.com | Volume – 2 | Issue – 1 | Nov-Dec 2017 Page: 411
International Journal of Trend in Scientific Research and Development (IJTSRD) ISSN: 2456-6470 by them was that more features utilized in the models do not necessarily make results better [4]. Although many researchers have worked hard to determine the actual cause of the survival of some passengers and demise of others, we attempt to get better results and accuracy by utilizing various different combination of features and different machine learning methods. IV. METHODOLOGY The first step in our methodology is to clean the training dataset. We start with exploring different attributes for NA values. We see that age column has 177 rows with NA values and cabin 687 rows with NA values. As most of the data in the cabin column is missing, we decided to drop this column from our analysis. We assume that age is a very important attribute. Hence, we decided to keep the age column for the analysis. We attempt to establish a relationship between the title of the passengers and their age. We believe that Ms. A is younger than Mrs. A and we also assume that the people having same titles are closer in age. Titles of the passengers have been extracted form the name of the passengers and we have replaced the name column with the extracted titles. The missing entries has been replaced by the average age of the particular title-group i.e. if there is a missing age value for a woman with title Mrs. then the missing value gets replaced with the average age of all the women with title Mrs.( shown in Figure 4). Fig. 3 Survival Histogram We performed some data cleaning in order to deal with the missing values. We saw that the dataset is not complete. There are various rows for which one or more fields are marked empty (especially age and cabin). We think that age could an important attribute to predict the survival of passengers. So we used a technique to replace the NAs in the age column. The gender column has been changed to 0 and 1 (0 for male and 1 for female) to fit the prediction model in a better manner. We also introduced some new variables into the dataset to predict the survival more closely. III. RELATED WORK Many researchers have worked on the Titanic problem in order to compare various different machine learning techniques in terms of the efficiency of the algorithm to predict the survival of the passengers. Studies have tried to trade-off between different features of the available dataset to provide the best prediction results. Lam and Tang et al. used the Titanic problem to compare and contrast between three algorithms- Naïve Bayes, Decision tree analysis and SVM. They concluded that sex was the most dominant feature in accurately predicting the survival. They also suggested that choosing important features for obtaining better results is important. There were no significant differences in accuracy between the three methods they used [2]. Shawn Cicoria and John Sherlock et al. performed Decision tree classification and Cluster analysis to suggest that sex is the most important feature as compared to other features in determining the likelihood of the survival of passengers [3]. Kunal Vyas and Lin et al. suggested that dimensionality reduction and playing more with the dataset could improve the accuracy of the algorithms. The most important conclusion provided Fig. 4 Average age In the past marine disasters the policy of Women Children First (WCF) has been used by the crew members giving women and children survival advantage over men [5]. Based on this social norm we decided to introduce some new attributes to strengthen our dataset and improve our analysis. A research study suggested [4] that titles such as ‘Dr’, ‘Col’, etc. from the Name column can be an important part of the analysis since it shows that these people are influential and respectable people. These attributes are listed in the table below: @ IJTSRD | Available Online @ www.ijtsrd.com | Volume – 2 | Issue – 1 | Nov-Dec 2017 Page: 412
International Journal of Trend in Scientific Research and Development (IJTSRD) ISSN: 2456-6470 A.NAÏVE BAYES TABLE V: NEW ATTRIBUTES AND THEIR DESCRIPTIONS Naïve Bayes is a classification algorithm that applies Bayes theorem to build a prediction model. There are different types of Naïve Bayes theorem. In this analysis, we used Gaussian Naïve Bayes algorithm. The algorithm starts by creating summaries of the train data which involves calculating mean and the standard deviation for each attribute, by class value. The prepared summaries are used for prediction. Prediction involved calculating the probability for a particular data sample to belong to each of the two class. The class with the largest probability value was considered as the predicted class. Classification accuracy was obtained by comparing the predictions to the class values of the test data [6]. We got a classification accuracy of 91.38755%. New Attributes Mother Description Column value is 1 only if the title is Mrs. and value of parch is greater than 0. Otherwise, 2 is assigned. Column value is 1 only if age is less than or equal to 14. Otherwise, 2 is assigned. Children Family Z= X+Y+1 where X is the value of SibSp and Y is the value of Parch. Column value is 1 is the title is Dr, Rev, Capt., Col., Don. Or Lady. Otherwise 2 is assigned. Respectable TABLE VI: DATASET WITH NEW ATTRIBUTES Survived 0 1 Mother 2 Pclass 3 1 Name Mr Mrs 2 TABLE VII: DATASET WITH NEW ATTRIBUTES(CONTD.) Fig. 6 Prediction using Naïve Bayes B. LOGISTIC REGRESSION Age 22.00 38.00 SibSp 1 1 Parch 0 0 Sex Male Female After Naïve Bayes classification we implemented Logistic Regression. Logistic Regression is a type of classification algorithm in which the target variable is categorical and binary [7]. In our dataset survived column is the dependent variable which is both binary and categorical (1 for survival and 0 for demise). We start with building a model including all the features i.e. Pclass, Sex, Age, SibSp, Parch, Mother, Children, Family and Respectable. After running the model, we observed that family is the least significant variable. Hence, we dropped family from our dataset and built the model again (Figure 7). TABLE VIII: DATASET WITH NEW ATTRIBUTES(CONTD.) Respectable 2 2 Children 2 2 Family 2 2 Dataset after the addition of these attributes have been shown in the above tables (Table VI, VII, and VIII). We have dropped Name, Ticket, Cabin and Embarked out of our analysis as we believe these variables are not relevant to our analysis. Similarly, due to large variation in values, we also removed the fare attribute. @ IJTSRD | Available Online @ www.ijtsrd.com | Volume – 2 | Issue – 1 | Nov-Dec 2017 Page: 413
International Journal of Trend in Scientific Research and Development (IJTSRD) ISSN: 2456-6470 kept constant people with higher sex value are more likely to survive. This translates to females (sex value 1) are more likely to survive the disaster than males (sex value 0). Lastly, we determined the accuracy of the model using the test data. We got an accuracy of 94.26%. We assumed the decision boundary to be 0.5. The class for which the probability was greater than 0.5, we considered that class to be the predicted class. C.DECISION TREE Next, we carried on the analysis by implementing Decision tree algorithm [8]. Decision tree gave us some useful insights. Some of the insights are if a passenger is female and she belongs to a passenger class of either 1 or 2, then the probability of survival is 0.95 and if a passenger is male and is greater than or equal to an age of 13, then the probability of his survival is 0.16. The generated decision tree is shown in figure 9. Fig. 7 Summary of logistic model From the above results, we concluded that mother, parch and respectable are not stastically significant and they have high P-value. Pclass, sex and children are the most significant values as they have low P- values. We removed parch, mother and respectable from the dataset to build the logistic model again. The summary of the improved model is shown in figure 8. Fig. 9 Decision tree From the confusion matrix in Table IX, we conclude that out of 418 predictions, our model made 389 correct predictions, giving an accuracy of 93.06%. Fig. 8 Summary of the improved model The low P-values of Pclass and sex suggest that they have high correlation with the probability of having survived the disaster. The negative coefficient of Pclass implies that if all other variables are kept constant, people with higher Pclass value are less likely to survive. This basically means people with Pclass value 1 are more likely to survive than Pclass value 2 and people with Pclass value 2 are more likely to survive than Pclass value 3. Similarly, the positive coefficient of sex implies that if all other variables are @ IJTSRD | Available Online @ www.ijtsrd.com | Volume – 2 | Issue – 1 | Nov-Dec 2017 Page: 414
International Journal of Trend in Scientific Research and Development (IJTSRD) ISSN: 2456-6470 TABLE DECISION TREE IX: CONFUSION MATRIX FOR TABLE RANDOM FOREST Predicted X: CONFUSION MATRIX FOR Predicted Actual Survived: NO Actual Survived: NO Survived: Survived: YES 15 137 YES 18 134 Survived: NO Survived: YES 14 D.RANDOM FOREST 252 Survived: NO Survived: YES 16 250 From the above confusion matrix (Table X), we can see that out of total 418 predictions, our model made 384 correct predictions, percentage of 91.8%. giving an accuracy Next, we implemented Random forest algorithm for improving the accuracy of the classification model even further. Random forest algorithm is a classification algorithm that constructs a multitude of decision trees at the time of training and it outputs the class which is the mode of the individual trees [9]. We built our model with all the variables of our cleaned train dataset, that are Pclass, sex, Age, Family, Children, SibSp, Mother, Parch and Respectable. In order to understand the significance of all these different variables in the classification process, we used an argument “importance” while building our model. V. RESULTS We choose two metrics to compare the four classification techniques we used in this research paper. First metric is accuracy and the second metric is false discovery rate. We calculate both this metrics using confusion matrix. Accuracy is the measure of how well our model predicts. Higher the accuracy the better. This is not the case for the second matrix. For the problem used in the research paper, false discovery rate is an important metric as it would be dangerous if we predict a passenger would survive but in truth he does not survive. Hence lower the false discovery rate the better. The accuracy and false discovery rate for each of the algorithm is listed in the table below: TABLE XI: COMPARISON OF ALGORITHMS Algorithm Naïve Bayes Logistic Regression Decision Tree Random Forest VI. CONCLUSION/FUTURE WORK Accuracy 91.3% False Discovery Rate 15.47% Fig. 10 Variable importance 93.54% 8.60% 93.06% 9.06% From the above figure (Figure 10) we saw that Sex and Pclass play the most significant role in the classification model while Mother, Parch and Respectable are the least significant variables. This is in alignment with our analysis using logistic regression algorithm. We then checked the accuracy of the random forest algorithm on the test data. 91.86% 10.66% We observed that Logistic Regression proved to be the best algorithm for the Titanic classification problem since the accuracy of Logistic Regression is @ IJTSRD | Available Online @ www.ijtsrd.com | Volume – 2 | Issue – 1 | Nov-Dec 2017 Page: 415
International Journal of Trend in Scientific Research and Development (IJTSRD) ISSN: 2456-6470 4.Vyas, K., Zheng, Z. and Li, L, “Titanic-Machine Learning From Disaster,” pp. 6, 2015. 5.Mikhael Elinder. (2012). Gender, social norms, and survival in maritime disasters [Online]. Available: http://www.pnas.org/content/109/33/13220.full. 6.Jason Brownlee. (2014). How to implement Naïve Bayes in Python from scratch [Online]. Available: http://machinelearningmastery.com/naive-bayes- classifier-scratch-python/ 7.Wikipedia. Logistic Available: https://en.wikipedia.org/wiki/Logistic_regression. 8.Trevor Stephens. (2014). Titanic: Getting Started With R - Part 3: Decision Trees [Online]. Available: http://trevorstephens.com/kaggle- titanic-tutorial/r-part-3-decision-trees/ 9.Trevor Stephens. (2014). Titanic: Getting Started With R - Part 3: Decision Trees [Online]. Available: http://trevorstephens.com/kaggle- titanic-tutorial/r-part-3-decision-trees/ the highest and the false discovery rate is the lowest as compared to all other implemented algorithms. We also determined the features that were the most significant for the prediction. Logistic regression suggested that Pclass, sex, age, children and SibSp are the features that are correlated to the survival of the passengers. It would be interesting to play more with dataset and introducing more attributes which might lead to good results. Various other machine learning techniques like SVM, K-NN classification can be used to solve the problem. Regression [Online]. REFERENCES 1.Kaggle, Titanic: Machine Learning form Disaster [Online]. Available: http://www.kaggle.com/ 2.Eric Lam, Chongxuan Tang. Titanic – Machine LearningFromDisaster.AvailableFTP: cs229.stanford.edu Directory: LamTang-TitanicMachineLearningFromDisaster.pdf 3.Cicoria, S., Sherlock, J., Muniswamaiah, M. and Clarke, L, “Classification of Titanic Passenger Data and Chances of Surviving the Disaster,” pp. 4-6, May 2014 proj2012 File: @ IJTSRD | Available Online @ www.ijtsrd.com | Volume – 2 | Issue – 1 | Nov-Dec 2017 Page: 416