Download
1 / 9
90 likes | 106 Vues
In computer science, Digital Image Processing or DIP is the use of computer hardware and software to perform image processing and computations on digital images. Generally, digital image processing requires the use of complex algorithms, and hence, can be more sophisticated from a performance perspective at doing simple tasks. Many applications exist for digital image processing, one of which is Digital Image Transformation. Basically, Digital Image Transformation or DIT is an algorithmic and mathematical function that converts one set of digital objects into another set after performing some operations. Some techniques used in DIT are image filtering, brightness, contrast, hue, and saturation adjustment, blending and dilation, histogram equalization, discrete cosine transform, discrete Fourier transform, edge detection, among others. This paper proposes a set of digital image transformation algorithms that deal with converting digital images from one domain to another. The algorithms to be implemented are grayscale transformation, contrast and brightness adjustment, hue and saturation adjustment, histogram equalization, blurring and sharpening adjustment, blending and fading transformation, erosion and dilation transformation, and finally edge detection and extraction. As future work, some of the proposed algorithms are to be investigated with parallel processing paving the way to make their execution time faster and more scalable. Joe G. Saliby "Design & Implementation of Digital Image Transformation Algorithms" Published in International Journal of Trend in Scientific Research and Development (ijtsrd), ISSN: 2456-6470, Volume-3 | Issue-3 , April 2019, URL: https://www.ijtsrd.com/papers/ijtsrd22918.pdf Paper URL: https://www.ijtsrd.com/computer-science/computer-graphics/22918/design-and-implementation-of-digital-image-transformation-algorithms/joe-g-saliby<br>

E N D
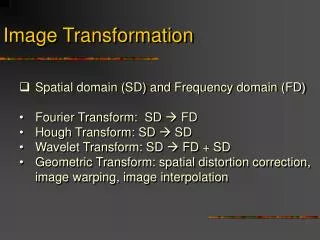
International Journal of Trend in Scientific Research and Development (IJTSRD) Volume: 3 | Issue: 3 | Mar-Apr 2019 Available Online: www.ijtsrd.com e-ISSN: 2456 - 6470 Design & Implementation of Digital Image Transformation Algorithms Joe G. Saliby Researcher, Lebanese Association for Computational Sciences, Beirut, Lebanon How to cite this paper: Joe G. Saliby "Design & Implementation of Digital Image Transformation Algorithms" Published in International Journal of Trend in Scientific Research and Development (ijtsrd), ISSN: 2456- 6470, Volume-3 | Issue-3 , April 2019, pp.623-631, URL: http://www.ijtsrd.co m/papers/ijtsrd229 18.pdf Copyright © 2019 by author(s) and International Journal of Trend in Scientific Research and Development Journal. This is an Open Access article distributed under the terms of the Creative Commons Attribution License (CC BY 4.0) (http://creativecommons.org/licenses/ by/4.0) I. GRAYSCALE TRANSFORMATION Grayscale is a range of shades of gray without apparent color. The darkest possible shade is black, which is the total absence of transmitted or reflected light. The lightest possible shade is white, the total transmission or reflection of light at all visible wavelengths. Intermediate shades of gray are represented by equal brightness levels of the three primary colors (red, green and blue) for transmitted light, or equal amounts of the three primary pigments (cyan, magenta and yellow) for reflected light [1]. In photography and computing, a grayscale digital image is an image in which the value of each pixel is a single sample, that is, it carries only intensity information. Images of this sort, also known as black- and-white, are composed exclusively of shades of gray, varying from black at the weakest intensity to white at the strongest. Grayscale images are distinct from one-bit bi-tonal black-and-white images, which in the context of computer imaging are images with only the two colors, black, and white. Grayscale images have many shades of gray in between. Grayscale images are also called monochromatic, denoting the presence of only one color. ABSTRACT In computer science, Digital Image Processing or DIP is the use of computer hardware and software to perform image processing and computations on digital images. Generally, digital image processing requires the use of complex algorithms, and hence, can be more sophisticated from a performance perspective at doing simple tasks. Many applications exist for digital image processing, one of which is Digital Image Transformation. Basically, Digital Image Transformation or DIT is an algorithmic and mathematical function that converts one set of digital objects into another set after performing some operations. Some techniques used in DIT are image filtering, brightness, contrast, hue, and saturation adjustment, blending and dilation, histogram equalization, discrete cosine transform, discrete Fourier transform, edge detection, among others. This paper proposes a set of digital image transformation algorithms that deal with converting digital images from one domain to another. The algorithms to be implemented are grayscale transformation, contrast and brightness adjustment, hue and saturation adjustment, histogram equalization, blurring and sharpening adjustment, blending and fading transformation, erosion and dilation transformation, and finally edge detection and extraction. As future work, some of the proposed algorithms are to be investigated with parallel processing paving the way to make their execution time faster and more scalable. KEYWORDS: Algorithms, Digital Image Processing, Digital Image Transformation IJTSRD22918 A.Implementation Image img = pictureBox1.Image; Bitmap bitmap = new Bitmap(img); // Cycling over all the pixels in the image for (int i = 0; i < bitmap.Size.Width; i++) { for (int j = 0; j < bitmap.Size.Height; j++) { Color color = bitmap.GetPixel(i, j); // Retreives the color of a particular pixel int R = color.R; // since the image is 8-bit Grayscale if (intensityTrackbar.Value == 2) { int upperBound = 271; // 271-16 = 255 int lowerBound = 0; for (int k = 1; k <= 16; k++) { upperBound = upperBound - 16; lowerBound = upperBound - 16; if (R <= upperBound && R > lowerBound) { R = upperBound; } @ IJTSRD | Unique Paper ID – IJTSRD22918 | Volume – 3 | Issue – 3 | Mar-Apr 2019 Page: 623
International Journal of Trend in Scientific Research and Development (IJTSRD) @ www.ijtsrd.com eISSN: 2456-6470 } } else if (intensityTrackbar.Value == 1) { int upperBound = 319; // 319-64 = 255 int lowerBound = 0; for (int k = 1; k <= 4; k++) { upperBound = upperBound - 64; lowerBound = upperBound - 64; if (R <= upperBound && R > lowerBound) { R = upperBound; } } } else if (intensityTrackbar.Value == 0) { if (R <= 255 && R > 127) R = 255; else R = 0; } bitmap.SetPixel(i, j, Color.FromArgb(R, R, R)); Figure 3: 2-bit Grayscale = 4 Levels } } Figure 1, 2, 3, and 4 depict an original image in 8 bits, 4 bits, 2 bits, and 1 bit grayscale mode respectively. Figure 4: 1-bit Grayscale = 2 Levels (Black & White) II. CONTRAST ADJUSTMENT Contrast is created by the difference in luminance, the amount of reflected light, reflected from two adjacent surfaces. There is also the Weber definition of contrast: Contrast = Lmax – Lmin Lmax Lmax = Luminance on the lighter surface Lmin = Luminance on the darker surface When the darker surface is black and reflects no light, the ratio is 1. Contrast is usually expressed as percentage value; the ratio is multiplied by 100. The maximum contrast is thus 100% contrast [2]. The symbols of the visual acuity charts are close to the maximum contrast. If the lowest contrast perceived is 5%, contrast sensitivity is 100/5=20. If the lowest contrast perceived by a person is 0.6%, contrast sensitivity is 100/0.6=170. A.Implementation public static Bitmap AdjustContrast(Bitmap Image, float Value) { Value = (100.0f + Value) / 100.0f; Value *= Value; Bitmap NewBitmap = (Bitmap)Image.Clone(); Figure 1: 8-bit Grayscale = 256 Levels Figure 2: 4-bit Grayscale = 16 Levels @ IJTSRD | Unique Paper ID - IJTSRD22918 | Volume – 3 | Issue – 3 | Mar-Apr 2019 Page: 624
International Journal of Trend in Scientific Research and Development (IJTSRD) @ www.ijtsrd.com eISSN: 2456-6470 BitmapData data = NewBitmap(); int Height = NewBitmap.Height; int Width = NewBitmap.Width; for (int y = 0; y < Height; ++y) { byte* row = (byte*)data.Scan0 + (y * data.Stride); int columnOffset = 0; for (int x = 0; x < Width; ++x) { byte B = row[columnOffset]; byte G = row[columnOffset + 1]; byte R = row[columnOffset + 2]; float Red = R / 255.0f; float Green = G / 255.0f; float Blue = B / 255.0f; Red = (((Red - 0.5f) * Value) + 0.5f) * 255.0f; Green = (((Green - 0.5f) * Value) + 0.5f) * 255.0f; Blue = (((Blue - 0.5f) * Value) + 0.5f) * 255.0f; int iR = (int)Red; iR = iR > 255 ? 255 : iR; iR = iR < 0 ? 0 : iR; int iG = (int)Green; iG = iG > 255 ? 255 : iG; iG = iG < 0 ? 0 : iG; int iB = (int)Blue; iB = iB > 255 ? 255 : iB; iB = iB < 0 ? 0 : iB; row[columnOffset] = (byte)iB; row[columnOffset + 1] = (byte)iG; row[columnOffset + 2] = (byte)iR; columnOffset += 4; } } { Color color = bitmap.GetPixel(i, j); // Retreives the color of a particular pixel int R = color.R; // since the image is 8-bit Grayscale --> R = G = B int G = color.G; // since the image is 8-bit Grayscale --> R = G = B int B = color.B; // since the image is 8-bit Grayscale --> R = G = B R+= intensity_level; G+= intensity_level; B+= intensity_level; bitmap.SetPixel(i, j, Color.FromArgb(R, G, B)); // Updating the bitmap with the new modified pixel } } IV. HSL stands for hue, saturation, and lightness, and is often also called HLS. HSV stands for hue, saturation, and value, and is also often called HSB. A third model, common in computer vision applications, is HSI, for hue, saturation, and intensity. However, while typically consistent, these definitions are not standardized, and any of these abbreviations might be used for any of these three or several other related cylindrical models [4]. HSL and HSV are the two most common cylindrical- coordinate representations of points in an RGB color model. The two representations rearrange the geometry of RGB in an attempt to be more intuitive and perceptually relevant than the Cartesian (cube) representation. Developed in the 1970s for computer graphics applications, HSL and HSV are used today in color pickers, in image editing software, and less commonly in image analysis and computer vision. Figure 5 depicts the HSL and HSV color spectrum. HUE & SATURATION ADJUSTMENT } III. Brightness is an attribute of visual perception in which a source appears to be radiating or reflecting light. In other words, brightness is the perception elicited by the luminance of a visual target [3]. This is a subjective attribute/property of an object being observed. A.Implementation Image img = pictureBox1.Image; Bitmap bitmap = new Bitmap(img); // Cycling over all the pixels in the image for (int i = 0; i < bitmap.Size.Width; i++) { for (int j = 0; j < bitmap.Size.Height; j++) BRIGHTNESS ADJUSTMENT Figure 5: HSL & HSV @ IJTSRD | Unique Paper ID - IJTSRD22918 | Volume – 3 | Issue – 3 | Mar-Apr 2019 Page: 625
International Journal of Trend in Scientific Research and Development (IJTSRD) @ www.ijtsrd.com eISSN: 2456-6470 A.Implementation public static Color[] GetColorDiagram(List<ControlPoint> points) { Color[] colors = new Color[256]; points.Sort(new PointsComparer()); for (int i = 0; i < 256; i++) { ControlPoint leftColor = new ControlPoint(0, GetNearestLeftColor(points[0].Color)); ControlPoint rightColor = new ControlPoint (255, GetNearestRigthColor(points[points.Count - 1].Color)); if (i < points[0].Level) { rightColor = points[0]; } if (i > points[points.Count - 1].Level) { leftColor = points[points.Count - 1]; } else { for (int j = 0; j < points.Count - 1; j++) { if ((points[j].Level <= i) & (points[j + 1].Level > i)) { leftColor = points[j]; rightColor = points[j + 1]; } } } if ((rightColor.Level - leftColor.Level) != 0) { double koef = (double)(i - leftColor.Level) / (double)(rightColor.Level - leftColor.Level); int r = leftColor.Color.R + (int)(koef * (rightColor.Color.R - leftColor.Color.R)); int g = leftColor.Color.G + (int)(koef * (rightColor.Color.G - leftColor.Color.G)); int b = leftColor.Color.B + (int)(koef * (rightColor.Color.B - leftColor.Color.B)); colors[i] = Color.FromArgb(r, g, b); } else { colors[i] = leftColor.Color; } } return colors; } V. In image processing and photography, a color histogram is a representation of the distribution of colors in an image. For digital images, a color histogram represents the number of pixels that have colors in each of a fixed list of color ranges that span the image's color space, the set of all possible colors [5]. The color histogram can be built for any kind of color space, although the term is more often used for three- dimensional spaces like monochromatic images, the term intensity histogram may be used instead. For multi-spectral images, where each pixel is represented by an arbitrary number of measurements (for example, beyond the three measurements in RGB), the color histogram is N-dimensional, with N being the number of measurements taken. Each measurement has its own wavelength range of the light spectrum, some of which may be outside the visible spectrum. A.Histogram Equalization Algorithm 1.Iterate over all the pixels and count the number of pixels that have a particular intensity 2.Store the results in a table and calculate the probability of each intensity using Number of pixels of a particular intensity level / total number of pixels in the image 3.Perform equalization using T(rk) = (L-1) Sum[i=0?k] Pr(i) = sk 4.Store the new results in a table and update the image by substituting the old intensity values by the new equalized ones. 5.Calculate the histogram distribution of the new generated image B.Implementation distribution = new double[256, 3]; // distribution[0]= # of pixels // distribution[1]= probability //distribution[2]= New Intensity level after Equalization Bitmap bitmap = new Bitmap(pictureBox1.Image); for (int i = 0; i < bitmap.Height; i++) { for (int j = 0; j < bitmap.Width; j++) { int intensity = bitmap.GetPixel(j, i).R; distribution[intensity, 0]++; } } // working with LISTVIEW listView1.Items.Clear(); int total = 0; double totalProbability = 0.0; for (int i = 0; i < distribution.GetLength(0); i++) { distribution[i, 1] = distribution[i, 0] / 87040.0; HISTOGRAM RGB or HSV. For @ IJTSRD | Unique Paper ID - IJTSRD22918 | Volume – 3 | Issue – 3 | Mar-Apr 2019 Page: 626
International Journal of Trend in Scientific Research and Development (IJTSRD) @ www.ijtsrd.com eISSN: 2456-6470 total = total + Convert.ToInt32(distribution[i, 0]); totalProbability = totalProbability + distribution[i, 1]; // Updating the listview just for illustration purposes // i represents the INTENSITY level ListViewItem item = new ListViewItem(new string[] { "" + i, "" + distribution[i, 0], distribution[i, 1].ToString("0.000000"), "" }); listView1.Items.Add(item); software, typically to reduce image noise and reduce detail. The visual effect of this blurring technique is a smooth blur resembling that of viewing the image through a translucent screen, distinctly different from the bokeh effect produced by an out-of-focus lens or the shadow of an object under usual illumination. Gaussian smoothing is also used as a pre-processing stage in computer vision algorithms in order to enhance image structures at different scales [7]. Mathematically, applying a Gaussian blur to an image is the same as convolving the image with a Gaussian function. This is also known as a two-dimensional Weierstrass transform. By contrast, convolving by a circle would more accurately reproduce the bokeh effect. Since the Fourier transform of a Gaussian is another Gaussian, applying a Gaussian blur has the effect of reducing the image's high-frequency components; a Gaussian blur is thus a low pass filter. A.Implementation double[] filter = new double[]{ Convert.ToDouble(textBox1.Text), Convert.ToDouble(textBox2.Text), Convert.ToDouble(textBox3.Text), Convert.ToDouble(textBox4.Text), Convert.ToDouble(textBox5.Text), Convert.ToDouble(textBox6.Text), Convert.ToDouble(textBox7.Text), Convert.ToDouble(textBox8.Text), Convert.ToDouble(textBox9.Text) }; Bitmap bitmap = (Bitmap)pictureBox1.Image; Bitmap bitmap2 = new Bitmap(bitmap.Width, bitmap.Height); for (int y = 0; y < bitmap.Height; y++) { for (int x = 0; x < bitmap.Width; x++) { int Rcenter = bitmap.GetPixel(x, y).R; int R0 = 0; R0 = bitmap.GetPixel(x - 1, y + 1).R; int R1 = 0; R1 = bitmap.GetPixel(x, y + 1).R; int R2 = 0; R2 = bitmap.GetPixel(x + 1, y + 1).R; int R3 = 0; R3 = bitmap.GetPixel(x - 1, y).R; int R5 = 0; R5 = bitmap.GetPixel(x + 1, y).R; int R6 = 0; R6 = bitmap.GetPixel(x - 1, y - 1).R; int R7 = 0; R7 = bitmap.GetPixel(x, y - 1).R; int R8 = 0; R8 = bitmap.GetPixel(x + 1, y - 1).R; int sum = Convert.ToInt32(((R0 * filter[0]) + (R1 * filter[1]) + (R2 * filter[2]) + (R3 * filter[3]) + (Rcenter * filter[4]) + } listView1.Items.Add(""); // EMPTY row listView1.Items.Add(new ListViewItem(new string[] { "Totals:", "" + total, "" + totalProbability, "" })); Figure 6 is about calculating the Intensity Distribution prior to historgram equalization which is depicted in Figure 7. Figure 6: Calculating the Intensity Distribution Figure 7: Performing Histogram Equalization VI. A Gaussian blur (also known as Gaussian smoothing) is the result of blurring an image by a Gaussian function. It is a widely used effect in graphics BLURRING & SHARPENING ADJUSTMENT @ IJTSRD | Unique Paper ID - IJTSRD22918 | Volume – 3 | Issue – 3 | Mar-Apr 2019 Page: 627
International Journal of Trend in Scientific Research and Development (IJTSRD) @ www.ijtsrd.com eISSN: 2456-6470 1.Iterate over all the pixels of both source images namely image 1 and image 2 2.On each iteration, read the intensity value of a particular pixel in image 1 and add it to the intensity value of the corresponding pixel in image 2 as in pixel(i , image3) = pixel(i , image1) + pixel(i , image2) 3.Check if the obtained value is larger than 255 then normalize it to 255 and if the obtained value is less than 0 (in case of subtraction) then normalize it to 0 4.Store the resulting value in a 3rd image 5.Upon scanning of all the pixel of both images 1 and 2, a new image 3 will be obtained and it is the result of image 1 + image 2 A.Implementation Button button = (Button)sender; Bitmap bitmap1 = new Bitmap(pictureBox1.Image); Bitmap bitmap2 = new Bitmap(pictureBox2.Image); Bitmap bitmap3 = new Bitmap(300, 300); for (int y = 0; y < bitmap1.Height; y++) { for (int x = 0; x < bitmap1.Width; x++) { Color color1 = bitmap1.GetPixel(x, y); Color color2 = bitmap2.GetPixel(x, y); int R1 = color1.R; int R2 = color2.R; int R3 = 0; if (button.Text == "+") R3 = R1 + R2; else if (button.Text == "-") R3 = R1 - R2; else if (button.Text == "*") R3 = R1 * R2; else if (button.Text == "/") { if (R2 != 0) R3 = R1 / R2; } if (R3 > 255) R3 = 255; else if (R3 < 0) R3 = 0; bitmap3.SetPixel(x, y, Color.FromArgb(R3, R3, R3)); } } pictureBox3.Image = bitmap3; pictureBox3.Refresh(); Figure 10 demonstrates the blending effect of two images; while, Figure 11 demonstrates the shading effect applied by a constant value to an image. (R5 * filter[5]) + (R6 * filter[6]) + (R7 * filter[7]) + (R8 * filter[8])) / 9); if (sum < 0) sum = 0; if (sum > 255) sum = 255; bitmap2.SetPixel(x, y, Color.FromArgb(sum, sum, sum)); } } pictureBox2.Image = bitmap2; Figure 8 demonstrates the blurring effect; while, Figure 9 demonstrates the sharpening effect on a particular image. Figure 8: Applying Blurring Effect Figure 9: Applying Sharpening Effect VII. BLENDING & FADING TRANSFORMATION Blending in graphics is about forming a blend of two input images of the same size. The value of each pixel in the output image is a linear combination of the corresponding pixel values in the input images [8]. Below is the algorithm for blending two input images together: @ IJTSRD | Unique Paper ID - IJTSRD22918 | Volume – 3 | Issue – 3 | Mar-Apr 2019 Page: 628
International Journal of Trend in Scientific Research and Development (IJTSRD) @ www.ijtsrd.com eISSN: 2456-6470 if pixelA is black OR pixelB is black then Set ResultPixel to black else then Set ResultPixel to white NOT operation (Complement) ?Scan images A pixel-by-pixel if pixelA is black then Set ResultPixel to white else then Set ResultPixel to black XOR operation ?Scan both images A and B simultaneously pixel- by-pixel if pixelA is black AND pixelB is black then Set ResultPixel to white else if pixelA is black OR pixelB is black then Set ResultPixel to black else then Set ResultPixel to white Difference operation (A-B) ?Scan both images A and B simultaneously pixel- by-pixel ?Apply the complement of B ?Then Apply the AND operation on A and B ?A AND (NOT B) Boundary Extraction ?Apply erosion on A and B ?Subtract the result form A (Use logical set differencing) ?A – (A erosion B) [10] Connected Components ?Connected component labeling works by scanning an image, pixel-by-pixel (from top to bottom and left to right) in order to identify connected pixel regions, i.e. regions of adjacent pixels which share the same set of intensity values V. ?When a point p is encountered (p denotes the pixel to be labeled at any stage in the scanning process for which V={1}), it examines the four neighbors of p which have already been encountered in the scan. Based on this information, the labeling of p occurs as follows: If all four neighbors are 0, assign a new label to p, else if only one neighbor has V={1}, assign its label to p, else if one or more of the neighbors have V={1}, assign one of the labels to p and make a note of the equivalences. ?After completing the scan, the equivalent label pairs are sorted into equivalence classes and a unique label is assigned to each class. As a final step, a second scan is made through the image, during which each label is replaced by the label assigned to its equivalence classes [11]. A.Implementation AND Operation Bitmap A = (Bitmap)pictureBox1.Image; Bitmap B = (Bitmap)pictureBox2.Image; Bitmap C = new Bitmap(319 , 240) ; for (int i = 0; i < A.Height; i++) Figure 10: Blending of Two Images Figure 11: Shading by a Constant VII. Erosion is about performing a special processing on a binary image. We successively place the center pixel of the structuring element on each foreground pixel (value 1). If any of the neighborhood pixels are background pixels (value 0), the foreground pixel is switched to background. On the other hand, to perform dilation, we successively place the center pixel of the structuring element on each background pixel [9]. If any of the neighborhood pixels are foreground pixels (value 1), the background pixel is switched to foreground. AND operation (Intersection) ?Scan both images A and B simultaneously pixel- by-pixel if pixelA is black AND pixelB is black then Set ResultPixel to black else then Set ResultPixel to white OR operation (Union) ?Scan both images A and B simultaneously pixel- by-pixel EROSION & DILATION TRANSFORMATION @ IJTSRD | Unique Paper ID - IJTSRD22918 | Volume – 3 | Issue – 3 | Mar-Apr 2019 Page: 629
International Journal of Trend in Scientific Research and Development (IJTSRD) @ www.ijtsrd.com eISSN: 2456-6470 { for (int j = 0; j < A.Width; j++) { int colorA = A.GetPixel(j, i).R; int colorB = B.GetPixel(j, i).R; if (colorA < 200 && colorB < 200) C.SetPixel(j,i,Color.FromArgb(0,0,0)) ; else C.SetPixel(j,i,Color.FromArgb(255,255,255)) ; } } pictureBox3.Image = C ; pictureBox3.Refresh(); Figure 12: Erosion Morphology Dilation byte* ptr = (byte*)data.Scan0; byte* tptr = (byte*)data2.Scan0; ptr += data.Stride + 3; tptr += data.Stride + 3; int remain = data.Stride - data.Width * 3; for (int i = 1; i < data.Height - 1; i++) { for (int j = 1; j < data.Width - 1; j++) { if (ptr[0] == 255) { byte* temp = tptr - data.Stride - 3; for (int k = 0; k < 3; k++) { for (int l = 0; l < 3; l++) { temp[data.Stride * k + l * 3] = temp[data.Stride * k + l * 3 + 1] = temp[data.Stride * k + l * 3 + 2] = (byte)(sElement[k, l] * 255); } } } ptr += 3; tptr += 3; } ptr += remain + 6; tptr += remain + 6; } bmpimg.UnlockBits(data); tempbmp.UnlockBits(data2); bmpimg = (Bitmap)tempbmp.Clone(); pictureBox2.Image = bmpimg; Figure 13: A – B (Difference) Figure 14: Boundary Extraction VIII. This paper proposed the design and implementation of a set of digital image transformation algorithms that deal with converting digital images from one domain to another. The algorithms implemented were grayscale transformation, contrast and brightness adjustment, adjustment, histogram equalization, blurring and sharpening adjustment, transformation, erosion and dilation transformation, and finally edge detection and extraction. The proposed algorithms were implemented using C#.NET and .NET Framework 3.5. CONCLUSIONS & FUTURE WORK hue and saturation blending and fading Figure 12 demonstrates the erosion and dilation effects when applied to a black and white image. Likewise, Figure 13 shows the difference logical operation over a particular image. Finally, Figure 14 shows the boundary extraction effect. @ IJTSRD | Unique Paper ID - IJTSRD22918 | Volume – 3 | Issue – 3 | Mar-Apr 2019 Page: 630
International Journal of Trend in Scientific Research and Development (IJTSRD) @ www.ijtsrd.com eISSN: 2456-6470 [5]Kenneth Castleman, “Digital Image Processing”, Prentice Hall, 1995 As future work, the proposed algorithms are to be reprogrammed to fit environment with the purpose of speeding up their execution and processing time. Acknowledgment This research was funded by the Lebanese Association for Computational Sciences (LACSC), Beirut, Lebanon, under the “Parallel Programming Algorithms Research Project – PPARP2019”. References [1]Rafael C. Gonzalez, Richard E. Woods, “Digital Image Processing”, 3rd Edition, Prentice Hall, 2007. in a multiprocessing [6]N. Bassiou, C. Kotropoulos, "Color image histogram equalization by absolute discounting back-off," Computer Understanding, vol. 107, no. 1-2, pp.108-122, 2007 [7]John C. Russ, “The Image Processing Handbook”, 6th Edition, CRC Press, 2011. Vision and Image [8]Ronny Richardson, "Digital imaging: The wave of the future", THE Journal, vol. 31, no.3, 2003 [9]Qi-Yu Liang, et al, "Observation of three-photon bound states in a quantum nonlinear medium", Science, vol. 359, no.6377, pp.783–786, 2018 [2]Maria Petrou, Costas Petrou, “Image Processing: The Fundamentals”, 2nd edition, Wiley, 2010 [10]Pietro Perona, Jitendra Malik, "Scale-space and edge detection using anisotropic diffusion", Proceedings of IEEE Workshop on Computer Vision, vol.1, pp. 16–22, 1987 [3]Mike Reed, "Graphic arts, digital imaging and technology education", THE Journal, vol.21 no.5, p.69, 2002. Computer Society [4]S. Naik and C. Murthy, "Hue-preserving color image enhancement without gamut problem," IEEE Trans, Image Processing, vol. 12, no. 12, pp. 1591–1598, 2003 [11]Guillermo Sapiro, "Geometric partial differential equations and image analysis", Cambridge University Press, 2001 @ IJTSRD | Unique Paper ID - IJTSRD22918 | Volume – 3 | Issue – 3 | Mar-Apr 2019 Page: 631