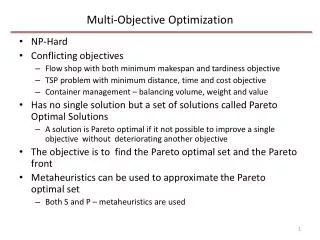
Multi-Objective Optimization of EDM Process Parameter by Topsis Method
40 likes | 78 Vues
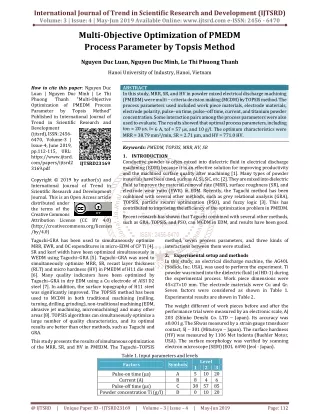
In this study, MRR, SR, and HV in powder mixed electrical discharge machining PMEDM were multi criteria decision making MCDM by TOPSIS method. The process parameters used included work piece materials, electrode materials, electrode polarity, pulse on time, pulse off time, current, and titanium powder concentration. Some interaction pairs among the process parameters were also used to evaluate. The results showed that optimal process parameters, including ton = 20 u00b5-s, I= 6 A, tof = 57 u00b5-s, and 10 g l. The optimum characteristics were MRR = 38.79 mm3 min, SR = 2.71 m, and HV = 771.0 HV. Nguyen Duc Luan | Nguyen Duc Minh | Le Thi Phuong Thanh "Multi-Objective Optimization of PMEDM Process Parameter by Topsis Method" Published in International Journal of Trend in Scientific Research and Development (ijtsrd), ISSN: 2456-6470, Volume-3 | Issue-4 , June 2019, URL: https://www.ijtsrd.com/papers/ijtsrd23169.pdf Paper URL: https://www.ijtsrd.com/engineering/manufacturing-engineering/23169/multi-objective-optimization-of-pmedm-process-parameter-by-topsis-method/nguyen-duc-luan<br>

Multi-Objective Optimization of EDM Process Parameter by Topsis Method
E N D
Presentation Transcript
International Journal of Trend in Scientific Research and Development (IJTSRD) Volume: 3 | Issue: 4 | May-Jun 2019 Available Online: www.ijtsrd.com e-ISSN: 2456 - 6470 Multi-Objective Optimization of PMEDM Process Parameter by Topsis Method Nguyen Duc Luan, Nguyen Duc Minh, Le Thi Phuong Thanh Hanoi University of Industry, Hanoi, Vietnam How to cite this paper: Nguyen Duc Luan | Nguyen Duc Minh | Le Thi Phuong Thanh Optimization of PMEDM Process Parameter by Published in International Journal of Trend in Scientific Research and Development (ijtsrd), ISSN: 2456- 6470, Volume-3 | Issue-4, June 2019, pp.112-115, URL: https://www.ijtsrd. com/papers/ijtsrd2 3169.pdf Copyright © 2019 by author(s) and International Journal of Trend in Scientific Research and Development Journal. This is an Open Access article distributed under the terms of the Creative Commons Attribution License (CC BY 4.0) (http://creativecommons.org/licenses /by/4.0) Taguchi-GRA has been used to simultaneously optimize MRR, EWR, and OC expenditures in micro-EDM of CP Ti [4]. SR and kerf width have been optimized simultaneously in WEDM using Taguchi–GRA [5]. Taguchi–GRA was used to simultaneously optimize MRR, SR, recast layer thickness (RLT) and micro hardness (HV) in PMEDM of H11 die steel [6]. Many quality indicators have been optimized by Taguchi–GRA in dry EDM using a Cu electrode of AISI D2 steel [7]. In addition, the surface topography of H11 steel was significantly improved. The TOPSIS method has been used to MCDM in both traditional machining (milling, turning, drilling, grinding), non-traditional machining (EDM, abrasive jet machining, micromachining) and many other areas [8]. TOPSIS algorithms can simultaneously optimize a large number of quality characteristics, and its optimal results are better than other methods, such as Taguchi and GRA. This study presents the results of simultaneous optimization of the MRR, SR, and HV in PMEDM. The Taguchi–TOPSIS ABSTRACT In this study, MRR, SR, and HV in powder mixed electrical discharge machining (PMEDM) were multi − criteria decision making(MCDM) by TOPSIS method. The process parameters used included work piece materials, electrode materials, electrode polarity, pulse−on time, pulse−off time, current, and titanium powder concentration. Some interaction pairs among the process parameters were also used to evaluate. The results showed that optimal process parameters, including ton = 20 µs, I= 6 A, tof = 57 µs, and 10 g/l. The optimum characteristics were MRR = 38.79 mm3/min, SR = 2.71 µm, and HV = 771.0 HV. Keywords: PMEDM, TOPSIS, MRR, HV, SR 1.INTRODUCTION Conductive powder is often mixed into dielectric fluid in electrical discharge machining (EDM) because it is an effective solution for improving productivity and the machined surface quality after machining [1]. Many types of powder materials have been used, such as Al, Si, SiC, etc.[2]. They are mixed into dielectric fluid to improve the material removal rate (MRR), surface roughness (SR), and electrode wear ratio (EWR) in EDM. Recently, the Taguchi method has been combined with several other methods, such as grey relational analysis (GRA), TOPSIS, particle swarm optimization (PSO), and fuzzy logic [3]. This has contributed to improving the efficiency of the optimization problem in PMEDM. Recent research has shown that Taguchi combined with several other methods, such as GRA, TOPSIS, and PSO, can MCDM in EDM, and results have been good. "Multi-Objective Topsis Method" IJTSRD23169 method, seven process parameters, and three kinds of interactions between them were studied. 2.Experimental setup and methods In this study, an electrical discharge machine, the AG40L (Sodick, Inc. USA), was used to perform the experiment. Ti powder was mixed into the dielectric fluid (oil HD-1) during the experimental process. Work piece dimensions were 45×27×10 mm. The electrode materials were Cu and Gr. Seven factors were considered as shown in Table 1. Experimental results are shown in Table 2. The weight different of work pieces before and after the performance trial were measured by an electronic scale, AJ 203 (Shinko Denshi Co. LTD − Japan). Its accuracy was ±0.001 g. The SRwas measured by a strain gauge transducer contact, SJ − 301 (Mitutoyo − Japan). The surface hardness (HV) was measured by 1106 Met Indenta (Buehler Motor, USA). The surface morphology was verified by scanning electron microscope (SEM) JEOL 6490 (Jeol - Japan). Table 1. Input parameters and levels Level 2 10 20 4 38 57 85 0 10 20 Factors Symbols 1 5 8 3 Pulse-on time (µs) Current (A) Pulse-off time (µs) Powder concentration Ti (g/l) A B C D 6 @ IJTSRD | Unique Paper ID - IJTSRD23169 | Volume – 3 | Issue – 4 | May-Jun 2019 Page: 112
International Journal of Trend in Scientific Research and Development (IJTSRD) @ www.ijtsrd.com eISSN: 2456-6470 Table 2. Results of experiments Exp. A B C D MR (mm3 / min) SR (µ µ µ µm) HV (HV) 1 1 1 1 1 10.262 2 1 1 2 2 8.643 3 1 1 3 3 2.766 4 1 2 1 2 10.211 5 1 2 2 3 14.283 6 1 2 3 1 0.036 7 1 3 1 3 37.599 8 1 3 2 1 23.598 9 1 3 3 2 44.02 10 2 1 1 2 19.586 11 2 1 2 3 4.025 12 2 1 3 1 17.407 13 2 2 1 3 10.391 14 2 2 2 1 0.355 15 2 2 3 2 26.748 16 2 3 1 1 30.09 17 2 3 2 2 62.561 18 2 3 3 3 16.739 19 3 1 1 3 0.999 20 3 1 2 1 20.954 21 3 1 3 2 4.955 22 3 2 1 1 0.209 23 3 2 2 2 6.652 24 3 2 3 3 18.79 25 3 3 1 2 10.544 26 3 3 2 3 25.126 27 3 3 3 1 54.091 3.56 2.96 2.46 3.72 3.55 1.43 4.60 3.24 4.29 4.27 2.11 3.03 3.33 1.92 4.37 4.65 4.36 2.70 2.45 4.33 2.36 2.09 2.72 3.65 3.25 3.30 5.55 482.4 602 591.3 507.0 810.3 566 524.3 727.1 673.0 490.3 772.3 699.2 599.2 624.3 641.7 470.8 846.6 685.8 498.4 672.8 560.9 441.9 560.9 672.8 453.0 680.8 791.6 3.Results and discussion Step1–The decision matrix: The indicators selected for optimization in PMEDM, the assigned quality characteristics, are as follows: xMRR with MRR, xSR with SR, and xHV with HV. MRR MRR . X= . . MRR Step 2–The normalized decision matrix: The normalized values are showed in Table 3 Table 3. Normalized data SR SR HV HV 1 1 1 2 2 2 . . . . . . SR HV 27 27 27 Vector normalization xi1 xi2 0.088 0.183 0.068 0.176 0.026 0.140 0.086 0.194 0.120 0.198 0.001 0.079 0.314 0.262 0.197 0.177 0.325 0.238 0.158 0.228 0.032 0.112 0.121 0.175 0.089 0.183 0.003 0.112 0.197 0.250 0.200 0.250 Exp A B C D E F G xi3 0.154 0.201 0.177 0.151 0.252 0.192 0.166 0.228 0.191 0.155 0.207 0.202 0.166 0.207 0.199 0.143 1 2 3 4 5 6 7 8 9 10 11 12 13 14 15 16 1 1 1 1 1 1 1 1 1 2 2 2 2 2 2 2 1 1 1 2 2 2 3 3 3 1 1 1 2 2 2 3 1 2 3 1 2 3 1 2 3 1 2 3 1 2 3 1 1 2 3 2 3 1 3 1 2 2 3 1 3 1 2 1 1 1 2 2 3 3 2 3 3 1 1 2 3 2 1 3 2 1 3 2 1 3 2 1 1 1 2 2 3 3 2 3 1 2 3 3 1 2 2 3 1 3 1 2 2 3 1 1 @ IJTSRD | Unique Paper ID - IJTSRD23169 | Volume – 3 | Issue – 4 | May-Jun 2019 Page: 113
International Journal of Trend in Scientific Research and Development (IJTSRD) @ www.ijtsrd.com eISSN: 2456-6470 17 18 19 20 21 22 23 24 25 26 27 2 2 3 3 3 3 3 3 3 3 3 3 3 1 1 1 2 2 2 3 3 3 2 3 1 2 3 1 2 3 1 2 3 2 3 3 1 2 1 2 3 2 3 1 3 1 1 2 2 3 3 1 1 2 3 2 1 3 2 1 1 1 2 2 3 3 2 3 2 3 1 1 2 3 3 1 2 0.500 0.144 0.010 0.174 0.037 0.002 0.057 0.165 0.089 0.217 0.455 0.243 0.150 0.140 0.236 0.135 0.124 0.158 0.192 0.177 0.177 0.309 0.276 0.208 0.162 0.190 0.192 0.142 0.166 0.187 0.136 0.207 0.253 Step 3–The weighted normalized decision matrix: WMRR = 0.2 for MRR, WSR = 0.4 for SR, WHV = 0.4 for HV. The weighted decision-making matrix is shown in Table 7. Step 4–The positive ideal solutions (PIS) and negative ideal solutions (NIS): Shown in Table 4. Table 4. PIS and NIS MRR A+ 0.0999 0.0317 0.1105 A- 0.0001 0.1237 0.0542 Step 5–The separation measures: Shown in Table 7. Step 6–The relative closeness to the ideal solution: The relative closeness index is calculated using Eq. 11, and shown in Table 7. Step 7–Ranking: The results clearly show that the 17th run is getting the first rank and good performance of the alternative Ai (Table 5). Table 5. TOPSIS values using vector normalization Exp. yi1 yi2 yi3 1 0.01756 0.07332 0.06170 0.10438 0.16869 0.618 2 0.02736 0.07026 0.08024 0.08755 0.19857 0.694 3 0.00528 0.05603 0.07082 0.10546 0.22707 0.683 4 0.01714 0.07770 0.06048 0.10708 0.15418 0.590 5 0.02395 0.07901 0.10094 0.08998 0.22735 0.716 6 0.00015 0.03174 0.07670 0.10534 0.30825 0.745 7 0.06273 0.10462 0.06631 0.09300 0.14628 0.611 8 0.03947 0.07091 0.09113 0.07459 0.23051 0.756 9 0.06504 0.09521 0.07625 0.08012 0.17801 0.690 10 0.03162 0.09105 0.06207 0.10262 0.12609 0.551 11 0.00646 0.04487 0.08275 0.09837 0.27525 0.737 12 0.02427 0.07004 0.08088 0.08982 0.20423 0.695 13 0.01776 0.07332 0.06649 0.10206 0.17240 0.628 14 0.00054 0.04465 0.08271 0.10400 0.27556 0.726 15 0.03948 0.10003 0.07978 0.09623 0.14349 0.599 16 0.03999 0.10003 0.05721 0.10534 0.11101 0.513 17 0.09991 0.09740 0.11052 0.06566 0.29764 0.819 18 0.02873 0.05997 0.08323 0.08129 0.23817 0.746 19 0.00210 0.05581 0.06463 0.11070 0.22270 0.668 20 0.03474 0.09433 0.07605 0.09672 0.14151 0.594 21 0.00732 0.05384 0.07692 0.10095 0.24072 0.705 22 0.00033 0.04947 0.05699 0.11444 0.24021 0.677 23 0.01136 0.06325 0.06629 0.10388 0.20146 0.660 24 0.03296 0.07661 0.07475 0.08818 0.18163 0.673 25 0.01783 0.07070 0.05424 0.10688 0.17495 0.621 26 0.04348 0.07091 0.08295 0.07402 0.21779 0.746 27 0.09102 0.12366 0.10139 0.09281 From the above tables, it is clear that the 17th running receives the 1st rank. Hence, the corresponding input parameters such as ton = 20 µs, I= 6 A, tof = 57 µs, and 10 g/l were found to be the optimum combination. 4.Conclusion In this study, MRR, SR, and HV in PMEDM using Ti powder have been MCDM by the TOPSIS method. The results of multi- criteria optimization in PMEDM using powder Ti show that: Optimal results using the TOPSIS method show that the 17th experiment was the best. However, values of the S/N ratio show that the optimal combination is ton =5 µs, I = 4A, tof = 57 µs, and 10 g/l. Optimal values are MRR = 38.79 mm3/min, SR = 2.71 µm, and HV = 771 HV. SR HV iS+ iS− Ci* Rank 21 12 14 25 9 5 22 2 13 26 6 11 19 8 23 27 1 4 17 24 10 15 18 16 20 3 7 0.1402 0.729 @ IJTSRD | Unique Paper ID - IJTSRD23169 | Volume – 3 | Issue – 4 | May-Jun 2019 Page: 114
International Journal of Trend in Scientific Research and Development (IJTSRD) @ www.ijtsrd.com eISSN: 2456-6470 References [1].Anirban B, Ajay B (2012) Effect of process variables on microhardness, grain size and strain during machining of various die steels with powder-mixed electric- discharge machining experimental design. Proc IME Part B: Journal of Engineering Manufacture 226: 1192-1204. optimization discharge machining parameters, The International Journal of Advanced Manufacturing Technology 64: 1459–1477. of Al2O3 powder-mixed electrical using dummy treated [8].Phan NH, Dong PV, Vu NN (2018) Application of TOPSIS to Taguchi method for multi-characteristic optimization of electrical discharge machining with titanium powder mixed into dielectric fluid, The International Journal of Advanced Manufacturing Technology, Vol.98(5-8), pp 1179–1198. [2].Gangadharudu T, Soumya G (2016) Effect of impregnated powder materials on surface integrity aspects of Inconel 625 during electrical discharge machining. Proc IME Part B: Journal of Engineering Manufacture: 1-14. [9].Long BT, Cuong NN, Phan NH, Vijaykumar SJ (2016) Optimization of PMEDM process parameter for maximizing material removal rate by Taguchi's method, International Manufacturing Technology, Vol. 87(5-8), pp 1929– 1939. [3].Mai C, Hocheng H, Huang S (2012) Advantages of carbon nanotubes in electrical discharge machining, International Journal of Advanced Manufacturing Technologyl 59, pp 111–117. Journal of Advanced [4].Ramesh S, Jenarthanan MP, Bhuvanesh KAS (2018) Experimental investigation of powdermixed electric dis chargemachining of AISI P20 steel using different powde rs and toolmaterials.Multidiscipline Materials and https://doi.org/10.1108/MMMS-04-2017-0025 [10].Long BT, Cuong NN, Phan NH, Toan ND (2016) Surface quality analysis of die steels in powder mixed electrical discharge machining using titanium powder in fine machining, Advances in Mechanical Engineering. Modeling Structures, in [11].Long BT, Cuong NN, Phan NH, Toan ND (2018) Multi- Characteristic Optimization of PMEDM Process Using Taguchi Method and Grey Relational Analysis for Die Steel Materials, Proc IMechE, Part E: Journal of Process Mechanical Engineering, Vol.8(7). [5].Gangadharudu T, Gangopadhayay S, Biswas CK (2017) State of the art in powder-mixed electric discharge machining: A review. Proc IME Part B: Journal of Engineering Manufacture 231: 2511-2526. [6].Shalini Mohanty, Ankan Mishra, B.K. Nanda, B.C. Routara (2017) Multi-objective optimization of nano powder mixed electrical discharge machining of AlSiCp using response surface methodology and particle swarm optimization. Alexandria Engineering https://doi.org/10.1016/j.aej.2017.02.006. [12].Toan ND, Phan NH, Long BT, (2018) Die steel surface layer quality improvement in titanium μ-powder mixed die sinking electrical International Journal of Advanced Manufacturing Technology, https://doi.org/10.1007/s00170-018- 2887-8 parametric discharge machining, Journal: 3-11, [7].Assarzadeh S, Ghoreishi M (2013) A dual response surface-desirability approach to process modeling and @ IJTSRD | Unique Paper ID - IJTSRD23169 | Volume – 3 | Issue – 4 | May-Jun 2019 Page: 115