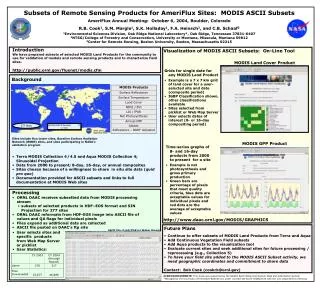
Download
1 / 21
210 likes | 469 Vues
Remote Detection of Eutrophic Events: MODIS and SeaWiFS. Joshua Moody jmoody18@eden.rutgers.edu Graduate Program in Ecology & Evolution Haskin Shellfish Research Laboratory Rutgers, the State University of New Jersey 6959 Miller Ave, Port Norris NJ 08349 (856) 785-0074 x4319.

E N D
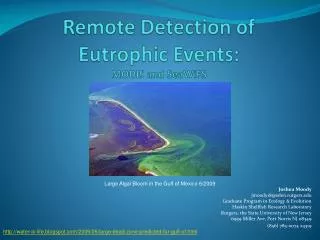
Remote Detection of Eutrophic Events:MODIS and SeaWiFS Joshua Moody jmoody18@eden.rutgers.edu Graduate Program in Ecology & Evolution Haskin Shellfish Research Laboratory Rutgers, the State University of New Jersey 6959 Miller Ave, Port Norris NJ 08349 (856) 785-0074 x4319 Large Algal Bloom in the Gulf of Mexico 6/2009 http://water-is-life.blogspot.com/2009/06/large-dead-zone-predicted-for-gulf-of.html
What is Eutrophication • Process whereby water bodies receive excess nutrients that stimulate excessive plant growth (algae, periphyton attached algae, and nuisance plants weeds). • Nutrients can come from many sources • Fertilizers • Nitrogen from the atmosphere • Erosion of soils containing nutrients • Sewage treatment plant discharges. • Why we care: Subsequent decomposition of plant material reduces dissolved oxygen in the water Source: USGS, http://toxics.usgs.gov/definitions/eutrophication.html
Extent of Continuous Eutrophic Conditions US Estuaries • High expressions of eutrophic conditions (US): • 44 estuaries • 40% of the national estuarine surface area: • Moderate expressions of eutrophic conditions (US) • 40 estuaries • When considered together: • 65% of the nation's estuarine surface area (NOAA: get full citation from laptop)
Indicators of Eutrophic Conditions • Primary: • elevated levels of chlorophyll a • Secondary: • depleted dissolved oxygen MODIS Chlorophyll image from Indian Sub-continent http://visibleearth.nasa.gov/view_rec.php?id=64
Detection of Chlorophyl a • Visual: • Algal blooms • Green water • May be hard to detect visually • Chemical: • In situ N and P levels • Remote: • Reflectance: 500-600nm and 700nm-3.5um • Absorption: 400-500nm and 600-700nm The absorption maxima of chlorophyll a are lambda= 430 and lambda= 662 nm, that of chlorophyll b are at 453 and 642 nm. http://www.biologie.uni-hamburg.de/b-online/e24/3.htm
Sensors • MODIS: MODerate-resolution Imaging Spectroradiometer • SeaWiFS: Sea-viewing Wide Field-of-view Sensor
MODIS • Aboard Terra and Aqua Satellites • Viewing the entire Earth's surface every 1 to 2 days • 36 spectral bands • Orbit: 705 km, 10:30 a.m. descending node (Terra) or 1:30 p.m. ascending node (Aqua), sun-synchronous, near-polar, circular • Swath: 2330 km (cross track) by 10 km (along track at nadir) • Bands 1 (620nm – 670nm), 3 (459nm – 479nm) & 4 (545nm – 565nm) commonly used • Bands 8 (405nm-420nm) to 16 (862nm – 877nm) primary use is for Ocean Color/Phytoplankton/ Biogeochemistry • Spatial Resolution: 250 m (bands 1-2)500 m (bands 3-7)1000 m (bands 8-36) http://modis.gsfc.nasa.gov/index.php http://earthobservatory.nasa.gov/Library/ESE/ese_2.html http://www.nasa.gov/centers/goddard/news/topstory/2003/0122japansnow.html
MODIS Two-Wavelength Empirical Algorithm (De Cauwer et al., 2004)
Aqua/MODIS -Phytoplankton Bloom in the Black Sea; Bands1,4,3; June 27, 2006 http://visibleearth.nasa.gov/view_rec.php?id=20903
SeaWiFS • Aboard GeoEye's OrbView-2 (SeaStar) satellite, an industry/government partnership with NASA's Ocean Biology Processing Group at Goddard Space Flight Center • Utilizes 8 spectral bands with narrow wavelength ranges from 402nm to 885nm • Orbit: 705 km circularsun-synchronous • Orbital Period: 99 minutes • Swath: Between 1,502km &2,800km depending on datafile storage (LAC/GAC) • Spatial Resolution: 1.1Km LAC; 4.5 Km GAC • Specifically designed to monitor ocean characteristics such as chlorophyll-a concentration and water clarity • Band 1 centered at 412nm specifically to identify yellow substances through increased blue wavelength adsorption • Band 3 centered at 490nm to increase sensitivity to chlorophyll concentrations • Band 7 (765nm) and Band 8 (865nm) in NIR are to specifically remove atmospheric attenuation- aerosols adsorb linearly in NIR • Able to tilt up to 20 degrees to avoid sunlight from the sea surface- important at equatorial latitudes where glint from sunlight often obscures water color http://oceancolor.gsfc.nasa.gov/SeaWiFS/ http://www.orbital.com/SatellitesSpace/ImagingDefense/OV2/index.shtml http://deepseanews.com/2007/09/
SeaWiFS Ocean Chlorophyll 4 Maximum Band Ratio Algorithm (De Cauweret al., 2004)
SEaWiFS natural color and a chlorophyll a map of the southern Atlantic Ocean of the Brazilian and Uruguayan coasts; 12-06-04 http://www.fas.org/irp/imint/docs/rst/Sect14/Sect14_13.html
How are the Events Detected? • Bio-optical reflectance and adsorption properties of organisms containing chlorophyll are known • Surface, and just below surface, concentrations of chlorophyll a are determined by the radiance received by the sensor • But satellite detection of chlorophyll concentrations suffer from uncertainties in the atmospheric correction and interference of other colored compounds. (Hu, 2005)
Atmospheric Correction • Retrieve water-leaving radiance • Calculate atmospheric effects at 750nm and 865 nm (NIR) where water-leaving radiance is minimal. • Extrapolate to visible wavelengths where chlorophyll a absorption is taking place • Input desired wavebands, extraterrestrial irradiance, wind speed, Rayleigh scatter, and aerosol/ozone concentration. • Output is normalized water leaving radiances at the 415-681 nm ocean wavebands http://oceancolor.gsfc.nasa.gov/VALIDATION/atm.html
Problem: Detecting Algal Blooms in Coastal Waters • Coastal waters can be the hosts of algal blooms- including harmful varieties (HABs) • The color of the ocean, i.e., the spectral water-leaving radiance, is the combined result of the properties of various colored constituents in the surface ocean: • Water molecules • Phytoplankton • Detritus • Colored dissolved organic matter • Suspended sediments • Bottom reflectance • These factors become a greater issue in shallow water where they can accumulate near the surface. (Hu, 2005)
Problem • Coastal areas have specific regional bio-optic properties • Algorithms (MODIS, MERIS and SeaWiFS) designed for use at a global scale-particularly for open ocean waters • Higher amounts of suspended matter and yellow substances can make it impossible to detect the contribution of chlorophyll a absorption in the blue range (De Cauweret al., 2004)
Remote sensing’s contribution to evaluating eutrophication in marine and coastal waters: Evaluation of SeaWIFS data from 1997 to 1999 in the Skagerrak, Kattegat and North Sea (Sorensen et al., 2002) • Chlorophyll-a maps obtained from SeaWiFS satellite images overestimate in situ observations of chlorophyll-a. • The use of a ’rescaling’ function for chlorophyll-a values, defined with in situ data taken at the same time as the satellite images, has significantly decreased the uncertainties in the chlorophyll-a maps, even though some coastal areas still highlight chlorophyll-a overestimates.
Red tide detection and tracing using MODIS fluorescence data: A regionalexample in SW Florida coastal waters (Hu et al., 2005) • MODIS sensors are equipped with several bands specifically designed to measure the fluorescence of phytoplankton • MODIS Chl a was estimated using a band-ratio algorithm (of all bands used to determine Ocean color) • MODIS FLH (Fluorescence Line Height) was estimated using a baseline subtraction algorithm of Bands 13 (667nm), 14 (678nm) and 15 (748nm) (A baseline is first formed between radiances for Bands 13 and 15, and then subtracted from Band 14 radiance to obtain the FLH. • MODIS FLH data showed the highest correlation with near-concurrent in situ chlorophyll-a concentration
MODIS medium resolution bands and Turbidity Index • Left Column: MODIS bands 1, 4, and 3 can clearly identify the distribution of the algal bloom • Right Column: turbidity index, a semi-quantitative measure of the amount of particulate material in the near-surface water. Darker areas show higher turbidity • While turbidity is not specific to algal blooms, it can be an estimate of the intensity of the bloom (Kahru et al., 2004) http://spg.ucsd.edu/Satellite_Projects/Various_HABs/Satellite_detection_of_HABs.htm
The Future • Higher resolution needed (as always)- for small scale blooms • Greater differentiation between algae and yellow particulate material- refined algorithms
Literature Cited • http://toxics.usgs.gov/definitions/eutrophication.html • http://modis.gsfc.nasa.gov/index.php • http://envisat.esa.int/instruments/meris/ • http://oceancolor.gsfc.nasa.gov/VALIDATION/atm.html • http://oceancolor.gsfc.nasa.gov/SeaWiFS/ • http://spg.ucsd.edu/Satellite_Projects/Various_HABs/Satellite_detection_of_HABs.htm • Carder, Kendall L. , F. Robert Chen, Zhongping Lee, Steve K. Hawes, and Jennifer P. Cannizzaro . 2003. MODIS Ocean Science Team Algorithm Theoretical Basis Document ATBD 19 Case 2 Chlorophyll a Version 7. College of Marine Science, University of South Florida. • De Cauwer, Vera, Kevin Ruddick, YoungJe Park, Bouchra Nechad and Michael Kyramarios. 2004. Optical Remote Sensing in Support of Eutrophication Monitoring in the Southern North Sea. EARSeL eProceedings 3; 208-222. • Hu, Chuanmin, Frank E. Muller-Karger, Charles (Judd) Taylor, Kendall L. Carder, Christopher Kelble, Elizabeth Johns and Cynthia A. Heil. 2005. Red tide detection and tracing using MODIS fluorescence data: A regional example in Southwest Florida coastal waters. Remote Sensing of Environment 97 (2005) 311 – 321. • Kahru, M., B.G. Mitchell, A. Diaz, M. Miura. MODIS Detects a Devastating Algal Bloom in Paracas Bay, Peru. EOS, Trans. AGU, Vol. 85, N 45, p. 465-472, 2004. • Sørensen, Kai , Gunnar Severinsen, Gunni Ærtebjerg, Vittorio Barale, Christian Schiller, and Anita Künitzer. 2002. Remote sensing’s contribution to evaluating eutrophication in marine and coastal waters: Evaluation of SeaWIFS data from 1997 to 1999 in the Skagerrak, Kattegat and North Sea . European Environment Agency. Copenhagen, Denmark.