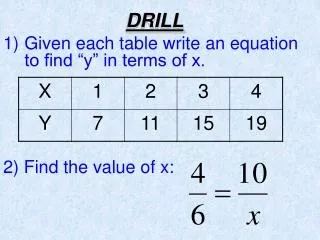
1.9 Patterns, equations, & Graphs
1.9 Patterns, equations, & Graphs. I can use tables, equations, and graphs to describe relationships. Equations with two variables. A solution of an equation with two variables x and y is the ordered pair ( x,y ). The ordered pair is only a solution if it makes the equation true.

1.9 Patterns, equations, & Graphs
E N D
Presentation Transcript
1.9 Patterns, equations, & Graphs I can use tables, equations, and graphs to describe relationships
Equations with two variables • A solution of an equation with two variables x and y is the ordered pair (x,y). • The ordered pair is only a solution if it makes the equation true. • Ex: is (3,10) a solution to the equation y= 4x? • NO
Different representations • Both Carrie and her sister Kim were born on October 25, but Kim was born 2 years before Carrie. • What are three different ways to represent the relationship between Kim’s age and Carrie’s age?
Equation • We know that Kim is 2 years older than Carrie. • How can we write an equation to show this relationship? • y = x + 2 • y = Kim’s age • x = Carrie’s age • What would the equation be if x = Kim’s age and y=Carrie’s age? • y = x – 2
Extending a pattern The table shows the relationship between the number of blue tiles and the total number of tiles . What is the total number of tiles in a figure with 8 blue tiles?
Using an equation • Recognize the pattern in the table. • As x increases by 1, y increases by 9. • y = 9x • Since x is the number of blue tiles, substitute 8 for x • y = 9(8) • y = 72 tiles
Try it! • In the same figure, create a table showing the relationship between the number of orange tiles and the total number of tiles. • Then, find how many total tiles will be in the figure if there are 28 orange tiles. • Hint: use a graph or an equation.
Assignment • ODDS ONLY • P. 64 #9-17, 21-31