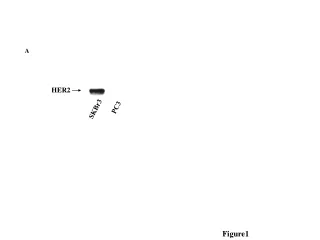
Figure1
A. HER2. PC3. SKBr3. Figure1. % of control. 120 100 80 60 40 20 0. 0 0.03 0.3 3 30 (µM). % of control. 120 100 80 60 40 20 0. 0 0.03 0.3 3 30 (µM). PC3 cells. SKBr3 cells. B. C. % of control. 120 100 80 60 40 20 0. Peptidimer-c.


Figure1
E N D
Presentation Transcript
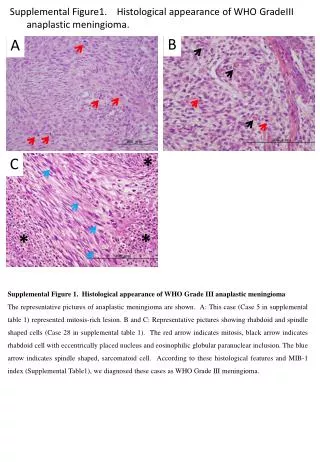
A HER2 PC3 SKBr3 Figure1
% of control 120 100 80 60 40 20 0 0 0.03 0.3 3 30 (µM) % of control 120 100 80 60 40 20 0 0 0.03 0.3 3 30 (µM) PC3 cells SKBr3 cells B C % of control 120 100 80 60 40 20 0 Peptidimer-c 0 0.03 0.3 3 30 (µM) % of control D 120 100 80 60 40 20 0 E Penetratin control 0 0.03 0.3 3 30 (µM) 120 100 80 60 40 20 0 F Irrelevant peptide 0 1 3 10 30(µM) Figure1
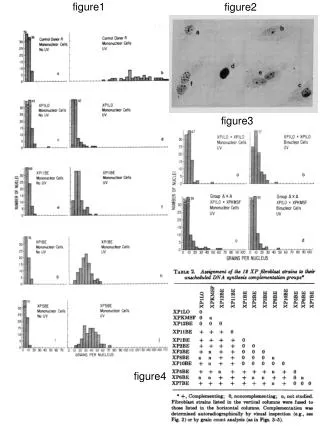
B A SKBr3 cells SKBr3 cells % of colonies/control value Peptidimer-c 0.03µM + Docetaxel 0.03nM Untreated cells Peptidimer-c 0.03µM Docetaxel 0.03nM Docetaxel 0.03nM + vector 0.03µM D C PC3 cells PC3 cells Peptidimer-c 0.03µM Docetaxel 0.03nM Peptidimer-c 0.03µM + Docetaxel 0.03nM % of colonies/control value Untreated cells Docetaxel 0.03nM + vector 0.03µM Figure 2
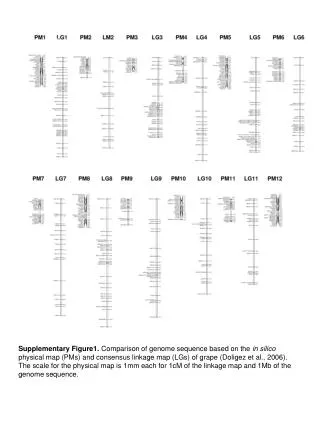
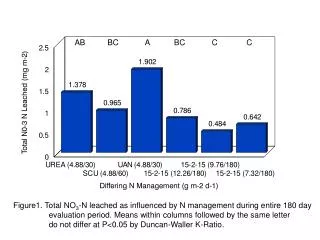
A Days D1 D2 D3 D4 D5 Lysis Docetaxel 24h Peptidimer-c 48h peptidimer-c 30µM docetaxel 10nM Seed cells C: control P: peptidimer-c D: docetaxel V: Vector C P D P+D V+D V 200 B Phospho-Shc 100 Total Shc 0 C Phospho-ERK 1/2 100 p44 p42 80 60 40 p44 p42 Total ERK ½ 20 0 D 100 Phospho-AKT 80 60 40 Total AKT 20 0 Actin E Figure 3
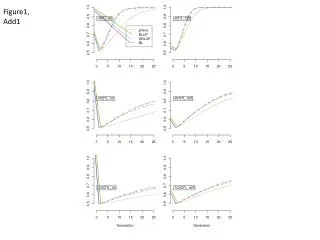
Days D1 D2 D3 D4 D5 D6 peptidimer-c 30µM docetaxel 10nM Seed of cells Lysis Docetaxel 48h Peptidimer-c 72h C: control P: peptidimer-c D: docetaxel PARP 116 kDa Cleaved PARP 85 kDa C P D P+ D Actin Figure 4
6 * p<0.05 5 * * * 4 3 Relative tumor volume 2 1 0 Days after beginning of treatment Figure 5A
120 100 80 60 40 20 0 Actin % pERK1/2 / Actin pERK1/2 1 2 3 4 D 0 D 2 D 0 D 2 Peptidimer-c Penetratin Figure 5B
Peptidimer-c 1.5 mg/kg i.p. Relative tumor volume control Days after beginning of treatment Figure 5C
Docetaxel 15mg/kg i.p. Peptidimer-c 1.5 mg/kg i.p. 6 Peptidimer-c 1.5mg/kg + docetaxel 15 mg/kg control 5 p<0.05 4 * * * * Relative tumor volume 3 * * Docetaxel 20mg/kg i.p. * 2 1 Peptidimer-c 1.5mg/kg + docetaxel 20mg/kg 0 Days after beginning of treatment Figure 6