Variance components-based linkage analysis
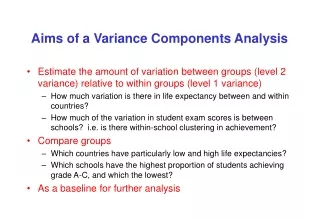
Variance components-based linkage analysis explores heritability by examining the phenotypic resemblance among related individuals, reflected in their identity-by-descent (IBD) sharing. This approach assumes a multivariate normal distribution of phenotypes to model covariances and means effectively. It discusses power calculations for detecting quantitative trait loci (QTLs), emphasizes figure covariate inclusion for enhanced linkage detection, and highlights pros and cons of the method. Understanding these elements can significantly enhance gene localization efforts in genetic studies.

Variance components-based linkage analysis
E N D
Presentation Transcript
Rationale of variance components-based linkage analysis The pattern of phenotypic similarity among pedigree members should be reflected by the pattern of IBD sharing among them at chromosomal loci influencing the trait of interest.
Variance components approach:multivariate normal distribution (MVN) In variance components analysis, the phenotype is generally assumed to follow a multivariate normal distribution: no. of individuals (in a pedigree) nn covariance matrix phenotype vector mean phenotype vector
Modeling the resemblance among relative heritability analysis linkage analysis
1 2 1 2 1 1 1 2 3 4 13 2 3 1 2 1 3 1 3 1 2 1 2 1 4 1 3 1 2 1 2 ? IBD IBS ? (also IBS) (not IBD) (both or neither IBD) Identity-by-state (IBS) vs. identity-by-descent (IBD) If IBD then necessarily IBS (assuming absence of mutation event). If IBS then not necessarily IBD (unless a locus is 100% informative, i.e. has an infinite number of alleles, each with infinitesimally small allele frequency).
1 2 1 2 1 1 1 2 2 3 3 4 13 1 2 1 2 1 3 1 3 1 2 1 4 1 3 1 2 1 2 Probabilistic inference of IBD IBD 1 0 0.5 1 1 2 1.5 1 0.5 0 0.25 0.5 NIBD p
Matrix of estimated allele sharing among relatives P M 12 33 S1 S2 S3 13 13 13
Power in variance components-based linkage analysis • Power in VC-based linkage analysis depends on several factors: • locus-specific (additive) heritability: • h2locus = Varlocus / Varall factors • Power scales linearly with square of h2locus. • residual (additive) heritability • pedigree complexity and size • information on transmission pattern (informativeness of marker genotypes)
Sample size requirements to detect linkage to a QTL with a lod score of ≥ 3 and 80% power (under random ascertainment)
Pros and cons ofvariance-components-based linkage analysis + no need to specify inheritance model (but typically assumes “additivity” + robust to allelic heterogeneity at a locus +modeling flexibility (for some phenomena) +computationally feasible even on large pedigrees - not always well-behaved statistically (depending on phenotypic distribution and ascertainment) - generally less powerful than penetrance-model-based linkage analysis under suitable model “quick but dirty”
Covariate selection • In linkage studies, covariates should be chosen in such a way that power to detect linkage (with genes of interest) is maximized. While the specific effects of these covariates may be of interest, this is clearly secondary to the goal of gene localization. • Covariates may be regressed out first, followed by linkage analysis of the residuals, or regression takes place simultaneous with linkage assessment. • Any combination of a given phenotype and a set of covariates ought to be considered a different trait. • Only few combinations ought to be analyzed, in order to avoid complications due to unnecessary multiple testing. • Interpretation of linkage results must take into account the chosen covariates.
Inclusion of covariates Measured covariates can easily be incorporated as “fixed effects” in the multivariate normal model of the phenotype, by making the expected phenotype different for different individuals as a function of the measured covariates.
Inclusion of covariates If covariates are not of interest in and of themselves, one can “regress them out” before pedigree analysis. Then use residuals as phenotype of interest in pedigree analysis.
Inference regarding covariatesin heritability analysis H0: measured covariate Y does not influencephenotype. H1: measured covariate Y does influence phenotype. Be cautious in interpretation.
Choice of covariates in gene mapping: “rules of thumb” • Covariates ought to be included in the likelihood model if they are known to influence the phenotype of interest and if their own genetic regulation does not overlap the genetic regulation of the target phenotype. • Typical examples include sex and age. • In the analysis of height, information on nutrition during childhood should probably be included during analysis. However, known growth hormone levels probably should not be.
A C 4 5 B Choice of covariates phenotypic variance due to 2 3 genes covariates 1 total phenotypic variance
Choice of covariates:special case of treatment/medication • Covariates are accounted for before or during analysis to reduce the phenotypic variance due to these covariates, thus simplifying the etiology of the trait and increasing power to detect the remaining etiological factors. • In contrast, the goal of accounting for treatment/medication is not to reduce phenotypic variance, but rather to increase it to the level at which it would have been w/o treatment/medication. • Accounting for treatment/medication by means of covariates achieves just the opposite, giving the same phenotypic mean to both treated and untreated individuals.
Before treatment/medicationof affected individuals unaffected affected
true effect of medication apparent effect of covariate After (partially effective) treatment / medication of affected individuals Accounting for medication with covariates adjusts in the wrong direction! unaffected affected
How to deal with treatment/medication • censor treated individuals • infer phenotype before treatment, or integrate over possible range of phenotype before treatment, based on information on treatment efficacy etc. • dichotomize phenotype All these approaches have drawbacks and are not entirely satisfactory.