Download
1 / 37
370 likes | 540 Vues
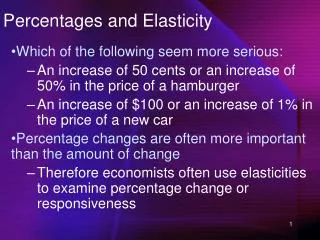
Percentages and Elasticity. Which of the following seem more serious: An increase of 50 cents or an increase of 50% in the price of a hamburger An increase of $100 or an increase of 1% in the price of a new car Percentage changes are often more important than the amount of change

E N D
Percentages and Elasticity • Which of the following seem more serious: • An increase of 50 cents or an increase of 50% in the price of a hamburger • An increase of $100 or an increase of 1% in the price of a new car • Percentage changes are often more important than the amount of change • Therefore economists often use elasticities to examine percentage change or responsiveness
Price Elasticity • Price Elasticity of Demand (Ep) • The responsiveness of quantity demanded of a commodity to changes in its price • Related to the slope, but concerned with percentage changes
Impact of a Change in Supply & Therefore Price on the Quantity Demanded … a large fall in price... S1 An increase in supply brings ... … and a small increase in quantity S0 40.00 30.00 Large price change and small quantity change Price (dollars per pizza) 20.00 10.00 5.00 Da 5 20 25 0 10 13 15 Quantity (pizzas per hour)
Impact of a Change in Supply… An increase in supply brings ... S1 … a small fall in price... 15.00 … and a large increase in quantity 40.00 S0 Small price change and large quantity change 30.00 Price (dollars per pizza) 20.00 Db 10.00 5 17 20 25 0 10 15 Quantity (pizzas per hour)
Price Elasticity Percentage change in quantity demanded E p Percentage change in price Price Elasticity of Demand The ratio of the two percentages is a number without units.
Price Elasticity When calculating the price elasticity of demand, we ignore the minus sign for % change in Q. • Example • Price of oil increases 10% • Quantity demanded decreases 1%
TYPES OF ELASTICITYHypothetical Demand Elasticities for 4 Products
Price Elasticity Ranges: Extreme Price Elasticities P1never touches the demand curve D Perfect inelasticity, zero elasticity, no matter how much Price changes, Quantity stays the same; insulin Perfect elasticity, infinite elasticity, the slightest increase in price will lead to zero sales. P1 P1 Price 30 D P0 Price 8 0 0 Quantity Demanded per Year (millions of units) Quantity Demanded per Year (millions of units)
Price Elasticity RangesSummary from Table • Elastic Demand • Unit Elastic • Inelastic Demand
Elasticity of Demand Change in Q Change in P E p Sum of quantities/2 Sum of prices/2 or Always use the mid-point formula or • Calculating elasticity
Calculating the Elasticity of Demand Original point 2/10 /Qave Elasticity = = 4 = /Pave 1/20 ΔP=1 New point Qave =1/2(11+9)=10 ΔQ=2 Pave =1/2(20.50+19.50)=20 Price (dollars/pizza) 20.50 20.00 19.50 D Quantity (pizzas/hour) 9 10 11
Elasticity of Demand (mid-point) 20% 4 = Ed = = 5% DQ = 2 X 100 %DQ =20% Q1 + Q2 (9 + 11) = 10 2 Ed = DP = $1.00 X 100 %DP =5% P1 + P2 ($20.50 + $19.50) = $20 2 Always use the mid-point formula for calculating elasticity
Changes in Elasticity Along a Linear Demand Elastic (EP> 1) Unit-elastic (EP = 1) Inelastic (EP < 1) Demand, or average revenue curve 1.10 1.00 .90 .80 .70 .60 Price per Minute ($) .50 .40 .30 .20 D .10 0 1 2 3 4 5 6 7 8 9 10 11 Quantity per Period (billions of minutes)
The Relationship Between Price Elasticity of Demand andTotal Revenues for Cellular Phone Service 21.000 6.333 Elastic 3.400 2.143 1.144 Unit-elastic 1.000 .692 .467 Inelastic .294 .158 $1.10 0 1.00 1 .90 2 .80 3 .70 4 .60 5 .50 6 .40 7 .30 8 .20 9 .10 10 Quantity Total Elasticity Price Demanded Revenue Ep 0 1.0 1.8 2.4 2.8 3.0 3.0 2.8 2.4 1.8 1.0
Total Revenue and Elasticity Total Revenue = Price Per GoodX# of Goods Sold TR = P X Q Assumption : Costs are constant
Elasticity and Total Revenue Elastic demand Unit elastic Inelastic demand Maximum total revenue When demand is inelastic, price cut decreases total revenue When demand is elastic, price cut increases total revenue 1.10 .80 Price .55 Quantity 0 55 110 3.00 (dollars) Total Revenue Quantity 0 55 110
Relationship Between PriceElasticity of Demand and Total Revenues Price Elasticity Effect of Price Change of Demand on Total Revenues (TR) Inelastic (EP < 1) TR ¯ TR Unit-elastic (EP = 1) No change No change Elastic (EP > 1) TR TR ¯ Price Price Decrease Increase
Total Revenue and Elasticity Total Revenue Test: Estimate the price elasticity of demand by observing the change in total revenue that results from a change in price (ceteris paribus). Note that revenue is maximized when elasticity of demand = -1.
Question • 2 drivers - Tom & Jerry each drive to to a gas station. • Before looking at the price, each places an order. • Tom says, “I’d like 10 litres of gas”. • Jerry says, “I’d like $10 of gas”. • What is each driver’s price elasticity of demand?
Determinants ofPrice Elasticity of Demand • Existence of substitutes • The length of time allowed for adjustment • More specifically a good is defined (more specific = more substitutes) • Necessity or not • Share of budget
Demand Elasticity and Time Pe D1 D2 D3 P1 Price per Unit As time passes, the demand curve rotates to D2 and then to D3 and quantity demanded lowers first to Q1 and then to Q2 Q3 Q2 Q1 Quantity Supplied per Period
Elasticity: Example • You are the consulting economist to the Guelph transportation commission, • The current fare is $.80 • There are 25,000 riders per day • For each $.01 increase (decrease) in the fare, rider ship decreases (increases) by 500 riders per day. • What is the price elasticity of demand at the current fare? • Should fares be raised or lowered? • What fare will maximize revenue?
Elasticity of Supply Change in Q Change in P E p Sum of quantities/2 Sum of prices/2 or Always use the mid-point formula or • Calculating elasticity
How a Change in Demand Changes Price and Quantity An increase in demand brings ... 30.00 … a large price rise... D1 … and a small quantity increase 13 Sa 40.00 Large price change and small quantity change Price (dollars per pizza) 20.00 10.00 D0 5 20 25 0 10 15 Quantity (pizzas per hour)
How a Change in Demand Changes Price and Quantity An increase in demand brings ... 21.00 … a small price rise... … and a large quantity increase D1 Small price change and large quantity change 40.00 30.00 Price (dollars per pizza) Sb 20.00 10.00 D0 5 20 25 0 10 15 Quantity (pizzas per hour)
Elasticity of Supply • Elasticity of supply ranges • (from) Perfectly Elastic Supply • Quantity supplied falls to 0 when there is any decrease in price • (to) Perfectly Inelastic Supply • Quantity supplied is constant no matter what happens to price Notice: There is no total revenue test for supply since price and quantity are directly related
Supply Elasticity Ranges Elasticity of supply = 0 Elasticity ofsupply= S Price Price S Quantity supplied is the same for any price! Suppliers will offer ANY quantity at this price 0 Quantity 0 Quantity
Elasticity of Supply: Depends On: • Resource substitution possibilities, -The more unique the resource, the moreinelastic the supply. • Time frame for the supply decision, Momentary supply Long-run supply Short-run supply • - The longer producers have to adjust to a price change, the more elastic is supply.
Supply Elasticity and Time S1 S2 S3 Pe Qe P1 Price per Unit As time passes, the supply curve rotates to S2 and then to S3 and quantity supplied rises first to Q1 and then to Q2 Q2 Q1 Quantity Supplied per Period
Elasticity: example-Tax Burden • Government levies a tax on a good: • who actually pays the tax, • what is the incidence of the tax, • who bears the burden of the tax. • Suppose that the tax is levied on the seller; i.e., the seller has to pay the tax Supply is affected
Explain the Effects of the Sales Tax • A $10 sales (excise) tax per MP3 player is imposed on the sellers of MP3 players. • There are now two “prices” for MP3 players: an after- tax price faced by buyers, and an after-tax price faced by sellers. • Will the price faced by buyers increase $10 after introducing the sales tax? By how much? • Will the price faced by sellers change? By how much?
Sales Tax Imposed on the Sellers S + tax $10 tax After Tax Market Price Tax revenue Supply is affected S 110 105 Price (dollars per player) 100 95 DA 3 4 5 6 Quantity (thousands of MP3 players per week)
Sales Tax: Who Pays? Tax Wedge After Tax Market Price Buyer pays tax Original Market Price Seller pays After Tax Price to Seller S + tax S 110 $10 tax 105 Price (dollars per player) 100 95 DA 3 4 5 6 Quantity (thousands of MP3 players per week)
Summary: • Taxes discourage market activity • Burden is shared, buyers pay more, sellers receive less, and • Tax burden falls most heavily on the side of the market that is least elastic in its response to a price change.
The Sales Tax: Who Pays? Demand Relatively Inelastic S + tax S 110 $10 tax 108 105 Price (dollars per player) 100 98 95 DA 3 4 5 6 Quantity (thousands of MP3 players per week)
The Sales Tax: Who Pays? Demand Relatively More Elastic. Tax Wedge Original Market Price S + tax S 110 $10 tax DA 105 103 Price (dollars per player) 100 95 93 3 4 5 6 Quantity (thousands of MP3 players per week)
Sales Tax: Who Pays When Tax Is Imposed on the Buyer? D-tax Original Market Price $10 tax S 110 105 Price (dollars per player) 100 95 DA 3 4 5 6 Quantity (thousands of MP3 players per week)