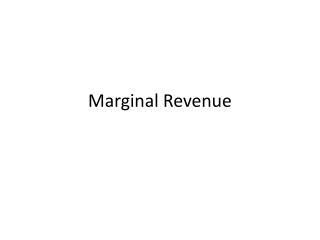
Revenue
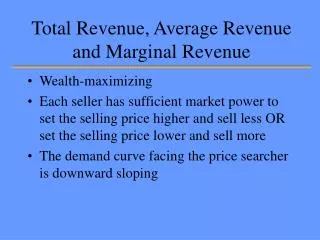
Revenue. Here we study a general idea of how a firm’s revenue is dependent on the demand for the firm’s product. Concepts related to revenue are also introduced. Demand and Total Revenue (TR).

Revenue
E N D
Presentation Transcript
Revenue Here we study a general idea of how a firm’s revenue is dependent on the demand for the firm’s product. Concepts related to revenue are also introduced.
Demand and Total Revenue (TR) Here the demand for the firm’s product is determined by the consumers of the product. Notice the lower the price, the greater the quantity demanded. All are charged the same price as well. For example, when the price is 18, all can buy at 18 and thus consumers only want 3 units. The total revenue (TR) is thus P times Q. • Q P TR = PQ • 22 22 • 20 40 • 18 54 • 16 64 • 14 70 • 12 72 • 10 70
Marginal revenue and average revenue The marginal revenue (MR) is defined as the change in TR divided by the change in Q. The average revenue (AR) is the TR divided by Q. • Q P TR = PQ MR AR • 22 22 22 22 • 20 40 18 20 • 18 54 14 18 • 16 64 10 16 • 14 70 6 14 • 12 72 2 12 • 10 70 -2 10
Demand, MR graph $ Here I have labeled the quantity values and I assume you can get the P from the demand info., and the MR info. From the table. D = AR 1 2 3 4 5 6 7 Q MR
MR notes Note here the demand curve is downward sloping. Without proof here, I tell you the MR curve will be downward sloping as well. Plus the MR curve will be steeper than the demand. In other word, at a given Q the price will be greater than the MR. The reason for this is that in order to sell additional units the price must be lowered to all buyers. The first unit could be sold at $22, but to sell a second unit the price must be $20 for each unit. The second unit is sold at $20, but the first unit is also sold at $20, when we had accounted for the first unit at $22. So the second unit adds 20 –2 = $18 to revenue.
AR notes Note the AR and the P are the same. This makes sense when all units sell at the same price because on all units you bring in the same amount so on average you bring in the same amount.