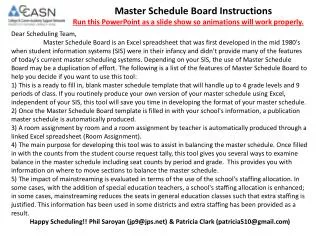
Master Schedule Board Instructions
Learn about using the Master Schedule Board Excel tool for efficient master scheduling in educational institutions. Features, benefits, and usage explained in detail.

Master Schedule Board Instructions
E N D
Presentation Transcript
Master Schedule Board Instructions Run this PowerPoint as a slide show so animations will work properly. Dear Scheduling Team, Master Schedule Board is an Excel spreadsheet that was first developed in the mid 1980's when student information systems (SIS) were in their infancy and didn't provide many of the features of today's current master scheduling systems. Depending on your SIS, the use of Master Schedule Board may be a duplication of effort. The following is a list of the features of Master Schedule Board to help you decide if you want to use this tool: 1) This is a ready to fill in, blank master schedule template that will handle up to 4 grade levels and 9 periods of class. If you routinely produce your own version of your master schedule using Excel, independent of your SIS, this tool will save you time in developing the format of your master schedule. 2) Once the Master Schedule Board template is filled in with your school's information, a publication master schedule is automatically produced. 3) A room assignment by room and a room assignment by teacher is automatically produced through a linked Excel spreadsheet (Room Assignment). 4) The main purpose for developing this tool was to assist in balancing the master schedule. Once filled in with the counts from the student course request tally, this tool gives you several ways to examine balance in the master schedule including seat counts by period and grade. This provides you with information on where to move sections to balance the master schedule. 5) The impact of mainstreaming is evaluated in terms of the use of the school's staffing allocation. In some cases, with the addition of special education teachers, a school's staffing allocation is enhanced; in some cases, mainstreaming reduces the seats in general education classes such that extra staffing is justified. This information has been used in some districts and extra staffing has been provided as a result. Happy Scheduling!! Phil Saroyan (jp9@jps.net) & Patricia Clark (patricia510@gmail.com)
When is Master Schedule Board Used? • This tool is used at two different times for balancing the master schedule: • During the building process - there is a point when you have decided on the number of sections of each course you need to place in the master schedule. You also have tentatively decided on the specific period placement of many if not all of the sections through the use of a course conflict matrix. At this point you don’t know for sure if all of the students will be scheduled properly when you submit your schedule to the student information system (SIS) to simulate a match between the student requests and the schedule you developed (a SIM run). The two most common mismatches are conflicts between sections offered during the same period and periods without sufficient sections to accommodate all students – in other words, a problem with balance in the master schedule. The Master Schedule Board tool is used at this time. You input the sections in the period placements you have developed with the counts from the student course request tally. Once this is done, this tool with show you, period by period, if your schedule will accommodate your students. It also provides you with several charts to assist you in balancing your schedule if needed. • After school starts – when you have “real” students sitting in classes, by inputting actual student counts for each section, the same charts that assisted you in balancing your master schedule with the projected counts from the student course request tally, will assist you in balancing class loads.
A Special Note About the Counts to be Entered from the Student Course Request Tally There are three procedures to follow when using the student course request tally to enter section counts in the master schedule board: In courses where sufficient student requests have been made to allow for more than 2 sections to be offered, enter the contractual class size maximum as the student count for each section. In courses where the counts are such that only one or two sections will be offered, take the student request count, divide it by the number of sections that will be offered and use that number as the class size. For example – if 40 students requested a course and you decide to offer two sections, use 20 as the student count in each section. In courses where students of multiple grade levels request the course, use “splits” as the counts to enter. For example – if 125 grade 9 students and 162 grade 10 students requested the same course, that would be a total of 287 students. If you had a maximum class size of 32, you would offer 9 sections of this course. Divide each student count by 9 sections to get the count to enter in each section for each grade – 14 for grade 9 and 18 for grade 10. This happens to work out to a total of 32 for each section, but if your particular case does not equal the maximum class size, just equally add numbers to each grade level count to make the sum of the splits equal to the maximum class size.
The Big Picture This is a much reduced view of the entire spreadsheet on the Master Schedule Board tab. This is intended for orientation only. Page 1 Page 18 • Page 1 – initial input area • Page 2-17 – schedule board • Page 18 – seat counts by department and average class size • Page 19 – special education seat analysis • Page 20 – seat counts by grade and period • Page 21-23 – staff utilization matrix Page 20 Page 21 Page 22 Page 23 Page 19 Page 2 - 17
Set-up-1 When you open Master Schedule Board for the first time, go to the input area that begins at cell N4; your yellow shaded cells will be blank. Fill in all the appropriate shaded cells in terms of a year’s schedule. Leave cells blank that don’t apply. Special Note: Throughout this tool, input information only in cells that are highlighted in a shade of yellow. The cells with formulas are not locked in order for you to inspect the function of this tool. Be careful, if formulas are changed or deleted, this tool will not function properly.
Set-up-2 Next, go to the Special Education input section area that begins at cell AF4. Your yellow highlighted cells will be blank. Fill in the teacher names and student counts by grade for your Special Education classes. Leave cells blank where there is no information to input.
Schedule Board Data Entry A B C D E F G H I J K L The rectangle highlighted in pink is an enlarged view of a typical period block that will normally appear without the cell borders like the example on the right. This information input area is really 12 Excel cells- given letters A-L here for explanation purposes. Special Note: Cells I, J, K, and L are the only cells that can contain numerical values. Entries in cells A-H must begin with an alphabetical/non-numerical character(numbers in cells A-H must be preceded by letters, an asterisk or quote marks. Do not use parentheses – Excel will treat a number in parentheses as a negative number yielding inaccurate results. Cells A, B, C – Enter course title here – input in cell A and the title can extend through cell C Cell D – Reserved for room number only. Always enter the room number with an alphabetical/non-numerical character first, for example: Rm 5 or C7 or *12 or “27” Cells E, F, G, H – These cells can be used for any information you want – as long as the entry begins with an alphabetical character Cell I – Reserved for student counts in the grade entered in cell R5 (most likely 9th grade) Cell J – Reserved for student counts in the grade entered in cell S5 (most likely 10th grade) Cell K – Reserved for student counts in the grade entered in cell T5 (most likely 11th grade) Cell L – Reserved for student counts in the grade entered in cell U5 (most likely 12th grade)
Schedule Board Data Entry Data entry in the schedule board area is by department. Shown below is a portion of the first department, English. The other department input areas are Math, History, Science, Boys PE, Girls PE (there is no need to separate by gender if your classes are coed – just use one input area), Foreign Language, Electives, Student Teacher Assistants, Resource and Self-Contained Special Education. Data entry in all of these department areas is identical except for Resource and Self-Contained students. We will explain the regular education method of entry first. Keep clicking and we will explain the input for the schedule board you see below. This sample schedule has been set up with 4 grade levels – 9th, 10th, 11th and 12th. These are the course titles of the sections being taught by each teacher English is the title of this department input area. All sections of English are input in this area. These are teacher names entered only in the yellow highlighted cells of column D. English teacher Fisk also teaches French. The parentheses around the course title is to set this off as not an English department section. Fisk would also be listed as a teacher in the Foreign Language department with French 1 listed in period 2. Notice that this period total count appears highlighted and in red. This happens when the class size total is over the average class size limit. This happens in all departments except Student Teacher Assistants , Resource and Special Education. This is the location to input the student course request counts for the grade level entered in cell R5 in the beginning setup section – in this example 9th grade. This is the location to input the student course request counts for the grade level entered in cell U5 in the beginning setup section – in this example 12thgrade. This is the location to input the student course request counts for the grade level entered in cell T5 in the beginning setup section – in this example 11thgrade. This total will appear highlighted and in red when the total student count exceeds the maximum case load for the teacher. This is where room numbers are entered. Remember to start this entry with a letter of the alphabet or an asterisk or quotation marks. Other non-course information can be entered in place of the course title like the teacher’s preparation period. This is the total number of English sections entered in the English department input area. Notice that there are no counts entered for this section. The counts for a French section would be entered in the Foreign Language department. The course is listed here to fill in the schedule as a reminder that this teacher cannot teach a section of English this period. This is the location to input the student course request counts for the grade level entered in cell S5 in the beginning setup section – in this example 10thgrade. Numbers in these cells are the sum of the counts entered in each individual section. If counts for students from different grade levels are entered, the sum for the individual period would appear here. This is the total count of students for all sections for each teacher. If the number of sections assigned in one row is over the maximum for an individual teacher, it will appear highlighted and in red. This is the total number of sections entered for each teacher in this department.
Back on slide 6 of this PowerPoint, we entered this sample information for the Self Contained Special Education and Resource teachers. When the teacher names are entered here, they are also automatically entered in the proper location of the master schedule board. On the next slide we will look at the data entry for the RSP teacher, Adams. The same procedure is used for the data entry for all Self Contained and RSP teachers.
This is the data entry area just for one special education teacher, in this case the Resource teacher, Adams. The only difference in the data entry in this area from the regular education teacher area is because Special Education teachers teach multiple subjects. This view is too small to show the details, so it will be broken into pieces for explanation purposes. Click once to proceed. Period 1 Period 2 Period 3 Period 4 Period 5 Here you see that Adams’ name is already entered and there are rows for the entry of student counts by subject. Since Adams teaches both English and Math, student count entries are made in two rows. Click again to proceed.
Here you see the 5 sections that Adams teaches – the three English sections are listed in the English row with the student counts by grade for the English sections. The two math sections are listed in the math row with the student counts by grade for the math sections. All the rest of the totals are the same as in the regular education section. You will notice that there is no count for the total number of sections taught for special education teachers. Sometimes multiple courses are taught in the same period so you might see both an English and a history class taught during a single period for example. The critical thing to remember here is to be sure to account (through the counts you enter) for all students each period they are taking classes with their special education teachers. These counts are used to determine the influence of your special education program on your staffing allocation. This will be explained later in this document. At this point you are ready to enter all of the data into the schedule board.
Teams, Linked Learning Cohorts and Academies A very simple and effective method of indicating special clusters of sections is through highlight colors and name labels. Here is an example: This highlight color and labeling would be followed for all cohort sections throughout the schedule board area. Printing this out for those who schedule students and participate in class balancing after the school year begins is very helpful in keeping cohort purity.
Once the schedule board is filled in, click on the Print Copy tab to find this short version of the master schedule. It is currently set to print 6 pages on legal sized paper in landscape orientation. The printing parameters are easily changed to meet your needs by changing page breaks or by using the Print Area function of Excel. The enlarged section at the bottom shows the information provided: the teacher name with the course taught and room number for each period. This version of the master schedule is organized by department.
Getting Balanced Once all the information is input into the schedule board, 5 different charts are generated to analyze the balance in your master schedule. • Total seat count by subject, grade and period • Section count by period and subject • Seat count by department and grade • Summary of seat counts compared with predicted counts • Seat and section counts by period and grade In each of the following examples of these 5 charts, only the English department counts have been filled in on the schedule board to simplify viewing.
Total seat count by subject, grade and period This is a view of the entire table that begins at cell BA32 This enlarged portion of the table shows just 3 of the 9 periods. When balancing a schedule, you look for sections that can be moved from one period to another. This chart helps you see the department, grade and period where there are high and low seat counts. The bottom of the chart provides totals by grade and period.
Section count by period and subject This is a view of the entire table that begins at cell BA64 This enlarged portion of the table shows just 3 of the 9 periods. This is another way of looking at balance – by section count in each period.
Seat count by department and grade This is a view of the entire table that begins at cell CV33 The enlarged portion below shows only the English department. Seat counts by department and grade is another way to look at schedule balance. Here it also shows you the total seats compared with the number of students at each grade level. Here it shows 25 extra seats at the 9th grade level – since there are 18 sections of English 9, this is just over 1 extra seat per section – a very tight schedule. With 36 extra seats at the 12th grade, English 12 may be a candidate for cutting a section if needed.
Summary of seat counts compared with predicted counts This is a view of the table that begins at cell CV81 This summary chart provides a quick overview of seat counts (again, only English is shown here). It will differ from the previous chart because of the inclusion of Resource and Self-Contained Special Education students in the calculations. The DIFF (difference) column is the seat count minus the predicted count. A positive number indicates extra seats, a negative number would indicate a shortage of seats.
Seat and section counts by period and grade This chart, beginning at cell DG32, has been found to be the most useful in balancing a master schedule. The total seat count for each period is shown by grade in the first column of each grade level. The second column shows the seat balance. A positive number means extra seats for the grade in the period, a negative number means a shortage of seats. The third column in each grade level is the seat balance in terms of sections. In first period, in the 9th grade there are 610 seats available which is 48 over the projected count of 562 (in this example) and this equals 1.539 sections. Don’t get too worried about 48 extra seats ; 562 students would need about 18 sections of class per period. This works out to be about 2.5 extra seats per section – a fairly tight schedule. Go on to the next slide to see more about balancing from this chart.
Seat Balancing by Grade and Period Seats Seat Sects Balance Seats Seat Sects Balance Seats Seat Sects Balance Seats Seat Sects Balance The red boxes indicate periods where seat counts are negative or low enough to cause concern. Twelve seats are a concern because the 10th grade class of 470 needs about 15 sections of class per period – this gives less than one extra seat per section. In an exceptionally balanced master schedule you should have at least 1 extra seat; most of the time we shoot for at least two extra seats per section. The green boxes indicate periods where seat counts may be excessive and where sections could be reduced and relocated into periods with shortages. In the next slide we will balance the seat count in the 9th grade.
Seat Balancing by Grade and Period Seats Seat Sects Balance Seats Seat Sects Balance Seats Seat Sects Balance Seats Seat Sects Balance 1 2 3 4 5 6 7 8 9 9th Grade class to 4th 2nd 2nd 9th Grade class from 6th 6th 7th Sections to move for balancing the 9th grade Enlarged view of 9th grade Balanced 9th grade
Moving Sections Moving sections is accomplished by going back to the schedule board section of the Master Schedule Board tool and deleting the section information in the period to be moved and then re-entering the section information in the period where you need it. Click to see an example of moving a 9th grade English section from period 2 to period 3 English 9 Rm 9 English 9 Rm 9 32 32 32 32 Seat count total Remember, only change information in the yellow highlighted areas. The seat count totals for each period are automatically calculated. After this change, the 9th grade seat count in the Seat and Section Counts by Period and Grade table will be 32 less in period 2 and 32 more in period 3.
There are a few more charts in this tool that are helpful. The Sections Needed chart beginning at cell DH53 gives you an estimate of the sections needed in each subject area based on predicted student counts. At this point in the master scheduling process, you most likely have a pretty good idea of these counts already, so this can serve as a double check.
The Actual Section Count Based on Average Class Size starting at cell DH87 gives you an idea of the effect of not being able to limit all sections to the average class size when compared with the Actual Section Count From the Master Schedule chart beginning at cell DQ87. If you were able to keep all sections of 9th grade English at the class average of 30, you would need 17.1 sections of class. The actual number of 9th grade English based on the class size maximum of 32 is 15.2 sections(487/32=15.2) This sample comes from a master schedule in the early building stage where only the English sections and a few others have been placed. The message above in RED confirms the status of section placement and will change to indicate balance or over allocation of sections beyond the staffing allocation.
The Staff Utilization Matrix shown in full on the left and enlarged below inside the red box (showing only the English department), begins at cell DX36. It is most useful after school begins and real student seat counts are input in the schedule board area. The negative numbers show where class sizes are over the maximum limit and the positive numbers show where students can be added to a section. If you want an additional way to keep track of FTE you can enter the values in the yellow highlighted column DZ, but it is not required for this table to function. The two columns of numbers on the right are just calculations for the table on the next slide.
This Utilization Summary by Department begins at cell EO36. With actual section counts input in the schedule board area of this tool, the numbers indicate the degree of staffing utilization by department. Getting numbers close to zero is a great thing!! Positive numbers mean that sections in the department are not filled to capacity and may indicate the need to reduce sections in the department; negative numbers mean that the entire department is overloaded and may indicate the need for additional sections in the department. 0.65 0.25 -0.15 0.47 0.51 0.73 2.51 If one FTE has a case load of 160, then multiply the department utilization number by 160 to see the number of student seats not utilized. In Math, with a 0.65 utilization, this equals 104 student seats and at 32 seats per section, this is about 3 sections of class. In a school with 1800 students taking Math, there would be about 56 sections of Math. This is just under 2 seats per section, so this is probably not an issue to fix. As the utilization numbers get over a value of 1.0, it is time to start looking for sections to collapse. Negative numbers need to be addressed.
Special Education This calculation area begins at cell DB1 In some situations, the seats gained from resource students in resource classes is less than the seats utilized in regular education classes from the mainstreaming of special education students. If this is the case for your school, once all of the seat counts are entered in the schedule board section, this set of calculations will result in a positive number. A negative number means that your regular education FTE is not impacted. Go to the next slide to see the results of the calculation.
There is no input necessary for this calculation other than all the counts in the schedule board area. If your projected counts are fairly accurate you may be able to use these figures to negotiate additional FTE (provided your totals in purple are positive numbers). You may have to enter actual student counts in the schedule board before you are able to argue for extra FTE. There are three calculations just to make sure the calculations are correct. The first looks by department and grade, the second in terms of FTE and the third in terms of seat counts.
Keys to a SIM Run with a High Percentage of Scheduled Students • Having a completely accurate Student Course Request Tally with all students requesting courses that will be offered and all students in correct courses (not part of this tool, but mentioned here as a reminder) • Utilizing the Course Conflict Matrix (not part of this tool, but mentioned here as a reminder) • Balancing seat counts • Accurately inputting the master schedule into your Student Information System (not part of this tool, but mentioned here as a reminder) Master Schedule Board is provided to you free of charge. If you like it and want to make copies to pass on to others, please do so. If you need assistance, please feel free to contact us.Happy Scheduling!! Phil Saroyan (jp9@jps.net) & Patricia Clark (patricia510@gmail.com) Visit us on the web and find a wealth of resources at: http://casn.berkeley.edu