Download
1 / 18
180 likes | 261 Vues
Explore alternate measurements of neighbourhood ethnic density and its impact on health outcomes among ethnic minorities. Examine subjective and objective measures, relationship with limiting long-term illness, and the relevance of different indicators in diverse ethnic groups.

E N D
Alternative ways of measuring neighbourhood ethnic density Mai Stafford & Laia Becares Dept Epidemiology & Public Health, UCL James Nazroo CCSR & School of Social Sciences, University of Manchester
Background • Evidence that higher proportion of co-ethnics in neighbourhood is associated with reduced risk of morbidity among ethnic minorities • “Ethnic density” effect • Plausible explanations (social support, racial discrimination, behavioural norms) • How should we measure neighbourhood ethnic density?
Explanatory pathways • Social support • shared culture, empathy, beliefs • Racial discrimination • interpersonal (conflict/concord between ethnic groups) • institutional (power, status) • Norms of health-related behaviour • customs, religious code
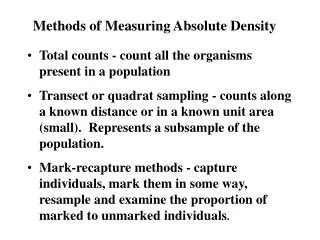
Objective measures of ED % in MSOA not white Captures ? % Indian
Subjective measures of ED • Citizenship Survey (2005) • Clustered in small areas due to sampling strategy “… thinking about people in this local area (15/20 mins walking distance), what proportion … are of the same ethnic group as you?’’ “All the same / more than half / about half / less than half”
Objective ED Cut-offs are Whites: 75%, 90%, 95%, 97.5%; Indians, Pakistanis and Bangladeshis: 1%, 10%, 20%, 40%; Caribbeans and Africans: 0.5%, 5%, 10%, 20%
Modelling ED and illness • What is relationship between ED and limiting long-term illness? • Regression model with robust standard errors to allow for hierarchy of ppts in small areas • Control for gender, age, SES and area deprivation as important correlates of limiting illness
Subjective ED and limiting illness Adjusted for age, gender, occupation-based socioeconomic group and area deprivation.
Objective ED and limiting illness Cut-offs are Whites: 75%, 90%, 95%, 97.5%; Indians, Pakistanis and Bangladeshis: 1%, 10%, 20%, 40%; Caribbeans and Africans: 0.5%, 5%, 10%, 20%. Adjusted for age, gender, occupation-based socioeconomic group and area deprivation.
Summary • There is positive correlation between objective and subjective indicators of ED • White ppts tended to underestimate % whites in MSOA • Participants from all other ethnic groups tended to overestimate % in their own ethnic group • Subjective ED was associated with long-term limiting illness (controlling for age, SES etc) • Subjective ED was more strongly associated with long-term limiting illness than was objective ED and associations were more consistent across ethnic groups • Real difference in association between ED and illness for Caribbean people?
Discussion • What explains failure to find association between objective ED and limiting illness? • Consider other health outcomes • Reasonably consistent evidence for protective association between objective ED and psychoses, anxiety/depression, suicide & self harm • Less consistent for physical health outcomes • Insufficient range of ED • Compare US where black density reaches much higher levels • BUT subjective ED was associated with illness in this study so above do not appear good explanations
Why might objective ED be less relevant than subjective ED for health? • MSOA may not be an appropriate geographical unit to summarise ED • Subjective ED based on participant’s own definition of their area • This may capture people’s movements and exposure more accurately • Ethnicity based on pre-defined categories in questionnaire • Assumes level of agreement between people in an area as to ethnic identification • Subjective ED based on participant’s categorisation of the people around them • Consider other health outcomes • Reasonably consistent evidence for protective association between objective ED and psychoses, anxiety/depression, suicide & self harm • Less consistent for physical health
Concluding remarks Study highlights difficulties in capturing the social and cultural aspects of ethnic identity using pre-defined categories & collective social phenomena using data aggregated to administrative areas Future studies may consider including subjective measures of ED
Thank you for listening! Mai Stafford m.stafford@ucl.ac.uk Am J Epidemiol. 2009;170(4):484-93.