IMPROVE Data Transparency and Education Hub
140 likes | 231 Vues
Explore IMPROVE platform for data access, QA/QC details, and global community collaboration. Stay updated with aerosol and optical data, and educational resources on air quality issues. Access comprehensive environmental datasets.

IMPROVE Data Transparency and Education Hub
E N D
Presentation Transcript
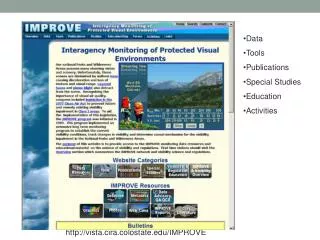
Data • Tools • Publications • Special Studies • Education • Activities http://vista.cira.colostate.edu/IMPROVE
IMPROVE Website Purpose • Transparency • Document IMPROVE activities: committee, laboratories, users • Inform users of data QA/QC activities and issues • Traceability • Document and provide access to ancillary data • Database version control with documentation • IMPROVE network operations metadata access/links • Calibration factors, Blank corrections • Accessibility • Provide access to data, metadata and data products • Community • Facilitate collaborative projects and interaction with others • Provide access to educational material and documents on visibility issues, science and regulations
IMPROVE International User Community • 1866 unique visitors in an average month (2200 in 2009) • 205000+ unique visitors since 2004 • Visitors from 179 different countries (164 in 2009) • China – 3767 • Korea – 1544 • Saudi Arabia - 328 • Hundreds of other websites Link to IMPROVE/VIEWS/FED
Additions - Data • IMPROVE aerosol data update - periodically • Final data is available through December 2012 • Jan –Feb, 2013 any day now • Regional Haze Rule data – through 2011 • 2012 data soon • Optical data updates • Nephelometer scattering data (quarterly) • 1993 through Mar 2013 data available from online database. • Apr-Jun, 2013 will be available soon • Transmissometer extinction data - discontinued
Additions – Data Continued • Adhoccommittee cleaned up, documented and maintain IMPROVE derived composite data • All RHR data reimported, will combine derived, patched and substituted data used in State SIP plans. All data will be flagged • Fixed mis-mapped data • Adding substituted data and flags - in progress • 2000-09 data have been frozen • Calculated values will be removed from the IMPROVE raw dataset • New IMPROVE composite derived dataset • Strip calculated values from the IMPROVE dataset • Contain multiple versions of composite values, e.g. OM=1.4*OC and 1.8*OC
Additions – Documents • 2012 IMPROVE Steering Committee Meeting Presentations • 2013 IMPROVE Calendar – (last one) • 2013 IMPROVE newsletters (behind) - (last ones) • SOPs • Carbon: updated TOR/TOT • Particle: updated Sample Handling and technical doc updated Optical Absorption Analysis • No new gray literature since 2010 • Data Advisory – no new advisories since 2010. Any pending?
Additions – Educational Interactive Tutorials • Monitoring Changing AQ in the Edwin B. Forsythe NWR (BRIG) • Working on an Acadia AQ tutorial and two more for FWL
FED’s Objective Web-based integrated environmental database and data aggregation delivery and visualization tools to support and facilitate environmental data assessments and reports by the National Park Service and Forest Service • Facilitate the analysis of environmental datasets for NPS and FS resource managers, scientist and general public • Increase the use of the environmental datasets • Reduce costs, increase efficiency and minimize conflicting data analyses often associated with individual and hand crafted analyses • Liberate data analysts from redundant, tedious, and laborious activates
FED’s Objective • Underlying database and infrastructure is designed to support multiple organizations and projects including NPS and FS air quality programs and IMPROVE data distribution. • NPS website provide summary data • Graphical products for NPS reports • Forest Service websites • IMPROVE website
Environmental Data • Raw datasets • IMPROVE aerosol, optical • NPS and SLAMS PM2.5, PM10 • NPS and SLAMS ozone • NADP wet deposition • CASTNet dry deposition • Forest Service water quality data • Other regional networks, e.g. SEARCH • Aggregated data values • RHR metrics • NAAQS metrics • Deposition metrics
Datasets to be included • IMPROVE aerosol data • Forest Service NRIS-Water quality data • hourly ozone concentrations (ppb) from continuous ozone monitors, including all EPA/AQS monitors, CASTNET monitors, NPS portable ozone monitors, 1988 to present • weekly passive ozone concentrations (ppb) from NPS passive ozone samplers • hourly meteorological parameters, including temperature, relative humidity, scalar wind speed, scalar wind direction, vector wind speed, vector wind direction, dew point, solar radiation, rainfall, and barometric pressure • hourly PM2.5 concentrations • hourly PM10 concentrations • hourly NO2 concentrations • hourly SO2 concentrations • hourly CO concentrations • CASTNET model estimates for hourly concentrations, dry deposition velocity, and dry deposition flux • weekly wet deposition concentrations, including Ca, Cl, K, Mg, Na, NH4, NO3, SO4, and Hg (mg/l and meq/l) • weekly wet deposition, including Ca, Cl, K, Mg, Na, NH4, NO3, SO4, and Hg (kg/ha) • nephelometer visibility measurements • Night sky brightness imagery
Derived Values • IMPROVE Derived Vales and Statics: • missing data estimated using algorithms specified in the Regional Haze Rule guidance documents • daily IMPROVE ambient particulate concentrations for ammonium nitrate, ammonium sulfate, coarse material, soil, organic mass, soot, sea salt, gravimetric PM2.5, and gravimetric PM10 • daily IMPROVE extinction estimates for ammonium nitrate, ammonium sulfate, coarse material, soil, organic mass, soot, sea salt, Rayleigh, total extinction, and deciview • daily IMPROVE visibility estimates in kilometers • annual mean, best days, median days, and worst days IMPROVE ambient particulate concentrations for ammonium nitrate, ammonium sulfate, coarse material, soil, organic mass, soot, sea salt, gravimetric PM2.5, and gravimetric PM10 • 3- and 5-year averages of annual mean, best days, median days, and worst days IMPROVE ambient particulate concentrations for gravimetric PM2.5 • annual mean, best days, median days, and worst days IMPROVE extinction estimates for ammonium nitrate, ammonium sulfate, coarse material, soil, organic mass, soot, sea salt, Rayleigh, total extinction, and deciview • annual mean, best days, median days, and worst days IMPROVE visibility estimates in kilometers • Ozone Statistics • daily maximum 1-hour ozone concentrations • annual maximum 1-hour ozone concentrations • annual 2nd highest 1-hour ozone concentrations • 3- and 5-year means of the annual 2nd highest 1-hour ozone concentration • daily maximum 8-hour ozone concentrations (calculated in accordance with EPA protocols) • annual maximum, 2nd highest, 3rd highest, and 4th highest 8-hour ozone concentrations, occurring during the local ozone monitoring season (determined in accordance with EPA protocols) • 3- and 5-year averages of the annual maximum, 2nd highest, 3rd highest, and 4th highest 8-hour ozone concentrations • 3-year average of the annual 4th highest 8-hour ozone concentrations (determined in accordance with EPA protocols) • 5-year average of the annual 4th highest 8-hour ozone concentrations • annual 90th percentile of 1-hour ozone concentrations • 3- and 5-year averages of the annual 90th percentile of 1-hour ozone concentrations • annual highest 3-month maximum ozone SUM60 (calculated in accordance with EPA protocols) • 3- and 5-year averages of the annual highest 3-month maximum ozone SUM60 • annual highest 3-month maximum ozone W126 sum (calculated in accordance with EPA protocols) • 5-year averages of the annual highest 3-month maximum ozone W126 sum • 3-year average of the annual highest 3-month maximum ozone W126 sum (calculated in accordance with EPA protocols) • annual mean 1-hour ozone concentration • annual mean 1-hour ozone concentration, calculated over the ozone season • 5-year average 1-hour ozone concentration • number of hours with 1-hour ozone concentration over 100 ppb during ozone season • Dry and Wet Deposition Statistics • annual mean deposition concentrations, including Ca, Cl, K, Mg, Na, NH4, NO3, SO4, and Hg (mg/l and meq/l) • 3- and 5-year averages of annual mean deposition concentrations (mg/l), including Ca, Cl, K, Mg, Na, NH4, NO3, SO4, and Hg • annual total wet deposition, including Ca, Cl, K, Mg, Na, NH4, NO3, SO4, and Hg • 3- and 5-year averages of annual total wet deposition, including Ca, Cl, K, Mg, Na, NH4, NO3, SO4, and Hg • Trend Statistics • trend slope and p-value for monitors in and near parks, including 10-year trends for 3-year averages of the annual 4th highest 8-hour ozone, and annual wet deposition concentrations of NH4, NO3, and SO4, and visibility conditions on the best and worst days • annual values used to compute 10-year trend slopes • Other Derived Datasets