Download
1 / 94
1.13k likes | 1.81k Vues
Speech and Image Processing Unit School of Computing University of Eastern Finland. Cluster validation. Clustering methods: Part 3. Pasi Fränti. 15.4.2014. Part I: Introduction. P. Cluster validation. Precision = 5/5 = 100% Recall = 5/7 = 71%. Supervised classification:

E N D
Speech and Image Processing UnitSchool of Computing University of Eastern Finland Cluster validation Clustering methods: Part 3 Pasi Fränti 15.4.2014
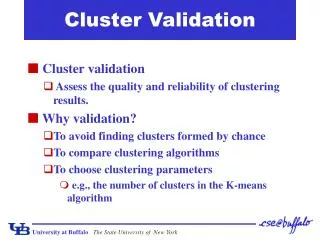
P Cluster validation Precision = 5/5 = 100% Recall = 5/7 = 71% Supervised classification: • Class labels known for ground truth • Accuracy, precision, recall Cluster analysis • No class labels Validation need to: • Compare clustering algorithms • Solve number of clusters • Avoid finding patterns in noise Oranges: Apples: Precision = 3/5 = 60% Recall = 3/3 = 100%
Internal Index: Validate without external info With different number of clusters Solve the number of clusters External Index Validate against ground truth Compare two clusters:(how similar) Measuring clustering validity ? ? ? ?
Clustering of random data Random Points DBSCAN K-means Complete Link
Cluster validation process • Distinguishing whether non-random structure actually exists in the data (one cluster). • Comparing the results of a cluster analysis to externally known results, e.g., to externally given class labels. • Evaluating how well the results of a cluster analysis fit the data without reference to external information. • Comparing the results of two different sets of cluster analyses to determine which is better. • Determining the number of clusters.
m* Partitions P Codebook C INPUT: DataSet(X) Clustering Algorithm Validity Index Different number of clustersm Cluster validation process • Cluster validation refers to procedures that evaluate the results of clustering in a quantitative and objective fashion. [Jain & Dubes, 1988] • How to be “quantitative”: To employ the measures. • How to be “objective”: To validate the measures!
Internal indexes • Ground truth is rarely available but unsupervised validation must be done. • Minimizes (or maximizes) internal index: • Variances of within cluster and between clusters • Rate-distortion method • F-ratio • Davies-Bouldin index (DBI) • Bayesian Information Criterion (BIC) • Silhouette Coefficient • Minimum description principle (MDL) • Stochastic complexity (SC)
The more clusters the smaller the MSE. Small knee-point near the correct value. But how to detect? Knee-point between 14 and 15 clusters. Mean square error (MSE)
5 clusters 10 clusters Mean square error (MSE)
Inter-cluster variance is maximized Intra-cluster variance is minimized From MSE to cluster validity • Minimize within cluster variance (MSE) • Maximize between cluster variance
Biggest jump on 15 clusters. Jump point of MSE(rate-distortion approach) First derivative of powered MSE values:
Sum-of-squares based indexes SSW / k ---- Ball and Hall (1965) k2|W| ---- Marriot (1971) ---- Calinski & Harabasz (1974) log(SSB/SSW) ---- Hartigan (1975) ---- Xu (1997) (d is the dimension of data; N is the size of data; k is the number of clusters) • SSW = Sum of squares within the clusters (=MSE) • SSB = Sum of squares between the clusters
Variances Within cluster: Between clusters: Total Variance of data set: SSB SSW
F-ratio variance test • Variance-ratio F-test • Measures ratio of between-groups variance against the within-groups variance (original f-test) • F-ratio (WB-index): SSB
Sum-of-square based index SSW / SSB & MSE SSW / m log(SSB/SSW) m* SSW/SSB
Davies-Bouldin index (DBI) • Minimize intra cluster variance • Maximize the distance between clusters • Cost function weighted sum of the two:
cohesion separation Silhouette coefficient[Kaufman&Rousseeuw, 1990] • Cohesion: measures how closely related are objects in a cluster • Separation: measure how distinct or well-separated a cluster is from other clusters
Silhouette coefficient • Cohesion a(x): average distance of x to all other vectors in the same cluster. • Separation b(x): average distance of x to the vectors in other clusters. Find the minimum among the clusters. • silhouettes(x): • s(x) = [-1, +1]: -1=bad, 0=indifferent, 1=good • Silhouette coefficient (SC):
x x cohesion separation Silhouette coefficient a(x): average distance in the cluster b(x): average distances to others clusters, find minimal
BIC= Bayesian Information Criterion L(θ) -- log-likelihood function of all models; n -- size of data set; m -- number of clusters Under spherical Gaussian assumption, we get : Formula of BIC in partitioning-based clustering d -- dimension of the data set ni -- size of the ith cluster ∑ i -- covariance of ith cluster Bayesian information criterion (BIC)
Knee Point Detection on BIC Original BIC = F(m) SD(m) = F(m-1) + F(m+1) – 2∙F(m)
Internal indexes Soft partitions
Part III: Stochastic complexity for binary data
Stochastic complexity • Principle of minimum description length (MDL): find clustering C that can be used for describing the data with minimum information. • Data = Clustering + description of data. • Clustering defined by the centroids. • Data defined by: • which cluster (partition index) • where in cluster (difference from centroid)
Solution for binary data where This can be simplified to:
Measure the number of pairs that are in: Same class both in P and G. Same class in P but different in G. Different classes in P but same in G. Different classes both in P and G. Pair-counting measures G P a a b b d d c c
Rand and Adjusted Rand index [Rand, 1971] [Hubert and Arabie, 1985] G P Agreement: a, d Disagreement: b, c a a b b d d c c
External indexes If true class labels (ground truth) are known, the validity of a clustering can be verified by comparing the class labels and clustering labels. nij= number of objects in class i and cluster j
Rand index(example) Rand index = (20+72) / (20+24+20+72) = 92/136 = 0.68 Adjusted Rand = (to be calculated) = 0.xx
Pair counting Information theoretic Set matching External indexes