Download
1 / 12
191 likes | 690 Vues
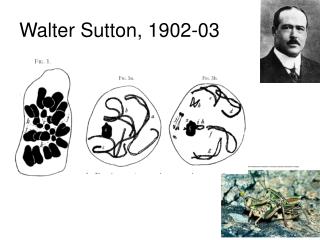
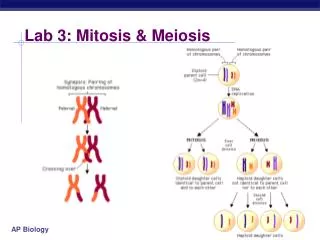
Lab 3: Mitosis & Meiosis. Lab 3: Mitosis & Meiosis. Description cell stages of mitosis exam slide of onion root tip count number of cells in each stage to determine relative time spent in each stage crossing over in meiosis farther gene is from centromere the greater number of crossovers

E N D
Lab 3: Mitosis & Meiosis • Description • cell stages of mitosis • exam slide of onion root tip • count number of cells in each stage to determine relative time spent in each stage • crossing over in meiosis • farther gene is from centromere the greater number of crossovers • observed crossing over in fungus, Sordaria • arrangement of ascospores
I P M A T Lab 3: Mitosis & Meiosis • Concepts • mitosis • interphase • prophase • metaphase • anaphase • telophase • meiosis • meiosis 1 • meiosis 2 • crossing over • tetrad in prophase 1
Lab 3: Mitosis & Meiosis • Conclusions • Mitosis • longest phase = interphase • each subsequent phase is shorter in duration • Meiosis • 4:4 arrangement in ascospores • no crossover • any other arrangement • crossover • 2:2:2:2 or 2:4:2
total crossover % crossover = total offspring % crossover distance fromcentromere = 2 Sordaria analysis
Lab 3: Mitosis & Meiosis ESSAY Discuss the process of cell division in animals. Include a description of mitosis and cytokinesis, and of the other phases of the cell cycle. Do not include meiosis. ESSAY Meiosis reduces chromosome number and rearranges genetic information. a. Explain how the reduction and rearrangement are accomplished in meiosis. b. Several human disorders occur as a result of defects in the meiotic process. Identify ONE such chromosomal abnormality; what effects does it have on the phenotype of people with the disorder? Describe how this abnormality could result from a defect in meiosis. c. Production of offspring by parthenogenesis or cloning bypasses the typical meiotic process. Describe either parthenogenesis or cloning and compare the genomes of the offspring with those of the parents.
Lab 4: Photosynthesis • Description • determine rate of photosynthesis under different conditions • light vs. dark • boiled vs. unboiled chloroplasts • chloroplasts vs. no chloroplasts • use DPIP in place of NADP+ • DPIPox = blue • DPIPred = clear • measure light transmittance • paper chromatography to separate plant pigments
Lab 4: Photosynthesis • Concepts • photosynthesis • Photosystem 1 • NADPH • chlorophylls & other plant pigments • chlorophyll a • chlorophyll b • xanthophylls • carotenoids • experimental design • control vs. experimental
Lab 4: Photosynthesis • Conclusions • Pigments • pigments move at different rates based on solubility in solvent • Photosynthesis • light & unboiled chloroplasts produced highest rate of photosynthesis Which is the control? #2 (DPIP + chloroplasts + light)
Lab 4: Photosynthesis ESSAY (part 1) A controlled experiment was conducted to analyze the effects of darkness and boiling on the photosynthetic rate of incubated chloroplast suspensions. The dye reduction technique was used. Each chloroplast suspension was mixed with DPIP, an electron acceptor that changes from blue to clear when it is reduced. Each sample was placed individually in a spectrophotometer and the percent transmittance was recorded. The three samples used were prepared as follows. Sample 1 — chloroplast suspension + DPIP Sample 2 — chloroplast suspension surrounded by foil wrap to provide a dark environment + DPIP Sample 3 — chloroplast suspension that has been boiled + DPIP Data are given in the table on the next page. a. Construct and label a graph showing the results for the three samples. b. Identify and explain the control or controls for this experiment. c. The differences in the curves of the graphed data indicate that there were differences in the number of electrons produced in the three samples during the experiment. Discuss how electrons are generated in photosynthesis and why the three samples gave different transmittance results.
Lab 4: Photosynthesis ESSAY 2004 (part 2)