Download
1 / 27
270 likes | 422 Vues
Light and the Electromagnetic Spectrum. it.pinellas.k12.fl.us/.../6B0A22E9A7C5461D8C11BC0EF0942658.p. TEKS. 6(B) understand the electromagnetic spectrum and the mathematical relationships between energy, frequency, and wavelength of light;

E N D
Light and the Electromagnetic Spectrum it.pinellas.k12.fl.us/.../6B0A22E9A7C5461D8C11BC0EF0942658.p...
TEKS • 6(B) understand the electromagnetic spectrum and the mathematical relationships between energy, frequency, and wavelength of light; • 6(C) calculate the wavelength, frequency, and energy of light using Planck's constant and the speed of light;
Light Phenomenon • Isaac Newton (1642-1727) believed light consisted of particles • By 1900 most scientists believed that light behaved as a wave.
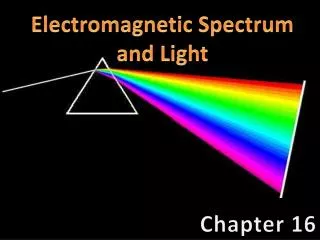
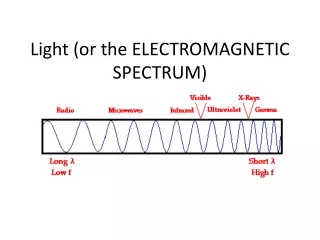
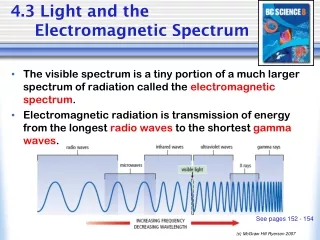
The Electromagnetic Spectrum The electromagnetic spectrum represents the range of energy from low energy, low frequency radio waves with long wavelengths up to high energy, high frequency gamma waves with small wavelengths.
Visible light is a small portion of this spectrum. This is the only part of this energy range that our eyes can detect. What we see is a rainbow of colors. RedOrangeYellowGreenBlueIndigoViolet ROY G BIV
Frequency Ranges • Wavelengths • 104 101 1 10-2 10-5 10-6 10-8 10-10 10-12 • Frequencies (cycles per sec) 3 x 10⁶ 3 x 10¹⁰ 3 x 10¹⁴ 3 x 10¹⁶ 3 x10¹⁸ 3 x10 22
FrequencyRanges ofVisibleLight Red light has a frequency of roughly 4.3 × 10¹⁴ Hz, and a wavelength of about 7.0 × 10⁷ m (700nm). Violet light, at the other end of the visible range, has nearly double the frequency—7.5 × 10¹⁴ Hz—and (since the speed of light is the same in either case) just over half the wavelength— 4.0 × 10⁷ m (400nm).
The radiation to which our eyes are most sensitive has a wavelength near the middle of this range, at about 5.5 x 10⁻⁷m (550 nm), in the yellow-green region of the spectrum.
It is no coincidence that this wavelength falls within the range of wavelengths at which the Sun emits most of its electromagnetic energy—our eyes have evolved to take greatest advantage of the available light.
C = λν • The frequency (v) of a wave is the number of waves to cross a point in 1 second (units are Hertz – cycles/sec or sec-1) • λ is the wavelength- the distance from crest to crest on a wave
The product of wavelength and frequency always equals the speed of light. C = λν • Why does this make sense? • NOTE: c is a constant value= 3.00 x 10⁸ m/s
PROBLEMS • Calculate the wavelength of yellow light emitted from a sodium lamp if the frequency is 5.10 x 10¹⁴ Hz (5.10 x 10¹⁴ s-1) List the known infoList the unknown c = 3.00 x 1010 cm/swavelength (λ) = ? cm Frequency (v) = 5.10 x 10¹⁴ s-1 C = λvλ = c v λ = 3.00 x 1010 cm/s = 5.88 x 10⁻⁵ cm 5.10 x 10¹⁴ s-1
YOUR TURN 1- What is the wavelength of radiation with a frequency of 1.50 x 10¹³ s-1? 2- What frequency is radiation with a wavelength of 5.00 x 10⁻⁶ cm? In what region of the electromagnetic spectrum is this radiation?
The colors we see in objects are the colors that are reflected, all other colors are absorbed. A red t-shirt appears red because red is reflected to our eyes and the other colors are absorbed. • When all colors are being reflected we see white light (white isn’t really a color)
When all wavelengths of light are being absorbed we see black (black also, isn’t really a color) • A false-color image is made when the satellite records data about brightness of the light waves reflecting off the Earth's surface.
These brightnesses are represented by numerical values - and these values can then be color-coded. It is just like painting by number. • The next slide shows a true color vs. false color image of the planet Uranus. Satellite images can be gathered in true color (what our eyes would see) and false color (to make it look better)
The true color image on left is how our eyes would see it. • The false color image is enhanced to bring out subtle details to make it easier to study Uranus’ cloud structure.
Atoms and Light • The movement of electrons inside of atoms produces light and other electromagnetic radiation. • Sunlight produces every color in the rainbow but… • Each element gives off only certain frequencies of light, called spectral lines. In effect each element has its own signature of spectral lines allowing us to identify which element we have or what stars are made of.
Below is a picture of the spectral lines given off by hydrogen. Note there are 3 different frequencies.
The emission spectra makes it possible to identify inaccessible substances. Most of our knowledge of the universe comes from studying the emission spectra of stars. • Below is the spectra of a few more elements. Helium
Neon • Argon
In a star, there are many elements present. The way we can tell which are there is to look at the spectrum of the star. • From spectral lines astronomers can determine not only the element, but the temperature and density of that element in the star • Emission lines can also tell us about the magnetic field of the star. The width of the line can tell us how fast the material is moving
If the lines shift back and forth, it means that the star may be orbiting another star - the spectrum will give the information to estimate the mass and size of the star system and the companion star.
Around a compact object (black hole, neutron star), the material is heated to the point it gives off X-rays, and the material falls onto the black hole or neutron star. By looking at the spectrum of X-rays being emitted by that object and its surrounding disk, we can learn about these objects.
Albert Einstein returned to the idea that light existed as particles. He proposed that light could be described as quanta of energy that behave as if they were particles. Light quanta are called photons. • While it was difficult for scientists to believe (they can be stubborn) it did explain the photoelectric effect (previously a mystery)
The photoelectric effect – When light shines on metals, electrons (photoelectrons) are ejected from their surface. • A certain frequency has to be achieved or the effect does not work Red light will not cause electrons to eject!
The photoelectric effect has practical applications in photoelectrical cells used for solar powered cars, and solar powered calculators.