Chapter 18 Introduction to Solid State NMR
Chapter 18 Introduction to Solid State NMR. 18.0 Summary of internal interactions in solid state NMR 18.1 Typical lineshapes for static samples 18.2 Magic-angle-spinning ( MAS ) 18.3 Cross polarization ( CP ) and CPMAS 18.4 Homonuclear decoupling pulse sequences

Chapter 18 Introduction to Solid State NMR
E N D
Presentation Transcript
Chapter 18 Introduction to Solid State NMR • 18.0 Summary of internal interactions in solid state NMR • 18.1 Typical lineshapes for static samples • 18.2 Magic-angle-spinning (MAS) • 18.3 Cross polarization (CP) and CPMAS • 18.4 Homonuclear decoupling pulse sequences • 18.5 Recoupling (CSA and dipolar) • 18.6 Multi-quantum MAS (MQMAS) of quadrupole spins • 18.7 Applications
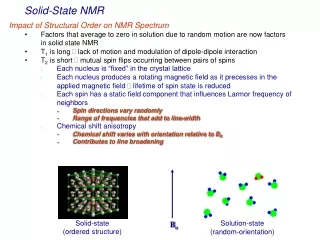
High resolution solid state NMR • Recoupling (Secoupling) • Resolution gap between LSNMR and SSNMR: still large but decreasing • “Solid NMR” in chemistry and condensed matter physics can be very different (the later normally uses conducting samples that contain large Knight shift)
Review of Lecture 9 for the summary of the four major interactions in NMR spectroscopy.
B0 Magic Angle Spinning (MAS) Θ=54.74°
33 22 Z X 11 Y Coordinate Systems
33 22 11 Coordinate Systems β Molecular frame (may be a PAS of certain interaction tensor) Lab Frame(XYZ)
How to calculate a solid NMR spectrum More generally,
Sensitivity • High Fields • Labeled samples • CP • CPMAS
Cross polarization • CPMAS─one of the most important solid state NMR techniques. • CP contact time: several hundred microseconds to tens of milliseconds. • Purpose: To enhance the sensitivity of the lower γ spins such as carbon-13. maximal enhancement factor: γI/γS • Other advantages: Shorter recycle delay time • Distinguish the interconnectivity of nuclear spins such as the protonation of a certain carbon nucleus.
1H-13C CPMAS spectrum of (a) mixed lactose, (b) -lactose and (c) anhydrous stable -lactose. The lines marked by asterisks are assigned to the residual amorphous lactose
Sodium silicate glasses Static 17O NMR spectra bridging (BO) and non-bridging (NBO) oxygens Na2Si2O5 Na2Si3O7 Na2Si4O9 NBO BO 600 0 -600 ppm
Structure of glasses (I) NBO BO
29Si NMR spectra for sodium silicate glasses static MAS Q4 mole % Na2O 34 37 41 Q3 Q2 Q3 + Q2 0 -100 -200 ppm -60 -80 -100
Structure of glasses (II) Q4 Q2 Q3 Q1
1H-29Si CPMAS intensity as a function of contact time Q2 Q3 Q4 Different sites in a Na2Si4O9 glass with 9.1 wt% H2O 0 20 40 contact time (ms)
Ramp CP(Matching Condition Satisfied at High Speeds) Acquisition X CP decoupling 1H
pl2 in dB 10 11 12 13 14 15 16 17 18 19 Comparison of standard and ramp-CP Carbonyl-signal of glycine (nat. abundance), nrot = 20 kHz, as function of 1H-power rectangle ramp
Double-CP CP 1 Decoupling Avoid CP 1H CP 2 Y Acquisition X
H-N-C Double- CPMAS: Spectral Simplification (A) CP-MAS 13C NMR spectrum and (B) 15N-13C double- CP/MAS NMR data of the [13C6,15N3]-His labeled LH2 complex, measured at 220 K by using a wide-bore 750 NMR spectrometer. The spinning rate around the magic angle was kept at 12 kHz. Each spectrum represents about 156 000 scans collected with an acquisition time of 8 ms and a recycle time of 2 s. The spectra are normalized at the α’ peaks. de Groot et al., JACS 123,4203(2001).
Shielding electronic shielding induced magnetic field Bloc = B0 – Bi = B0 (1 – s)
æ 1 1 ö s ( s + s ) ( s + s ) ç 2 2 xx xy yx xz zx ÷ 1 1 ç s = ( s + s ) s ( s + s ) ÷ s 2 xy yx yy 2 yz zy ç ÷ 1 1 ç ÷ ( s + s ) ( s + s ) s è ø xz zx yz zy zz 2 2 1 1 æ 0 ö ( s - s ) ( s - s ) ç 2 2 xy yx xz zx ÷ 1 1 ç s = ( s - s ) 0 ( s - s ) | as 2 yx xy 2 yz zy ç ÷ 1 1 ç | ( s - s ) ( s - s ) 0 è ø 2 2 zx xz zy yz Shielding Tensor: Decomposed Theoretically, CSA tensor contains anti-symmetric components, but the experimental evidence has been rather weak. It remains an interesting topic in fundamental NMR research.
Powder spectrum iso ,δ,
TOSS Example Proton NMR spectra of a water and hexadecane mixture in a sample of packed glass beads.
HZ HZ + HQ HZ + HQ (powder) 2H MAS Experimental (A) and simulated (B and C) 2H MAS NMR spectra (14.1 T) of KD2PO4 using ωr= 7:0 kHz. The simulated spectrum in (B) employs the optimized 2H quadrupole coupling and CSA parameters listed below whereas the simulation in (C) only considers the quadrupole coupling interaction. The asterisk indicates the isotropic peak.
Half-Integer Quadrupolar Spins:Central Transtion A few hundred Hz to several kHz
Satellite Transitions Static MAS Hundreds kHz to a few MHz!
Spin-3/2 23Na ( 105.8 MHz) NMR spectra of NaN03 recorded using (a) static and (b) MAS (v, = 4820 Hz) conditions ( 16 scans). The central transition is cut off at (a) 1/4 and (b) 1/13 of its total height.
JORGEN SKIBSTED, NIELS CHR. NIELSEN, HENRIK BILDME, HANS J. JAKOBSEN, JMR, 95, 88(1991)
Spin-5/2 27AI ( 104.2 1 MHz) MAS NMR spectra of the central and satellite transitions for α-Al2O3. The ppm scale is referenced to an external sample of 1 .0 M AlCl3, in H2O. (a) Experimental spectrum showing the relative intensities of the central and satellite transitions and observed using a Varian VXR-400 S wideline spectrometer; ωr= 7525 Hz, spectral width SW = 1 .0 MHz, pulse width pw = 1 .0 μs (π /4 solid pulse), and number of transients nt= 5 12. (b) Spectrum in (a) with the vertical scale expanded by a factor of ten; the inset shows expansion of a region where the second-order quadrupolar shift between the (±5/2, ±3/2)and the (±3/2, ±1/2)satellite transitions is clearly observed (see text). (c) Simulated MAS spectrum for the satellite transitions in (b) obtained using QCC = 2.38 MHz, η = 0.00, ωr= 7525 Hz, and Gaussian linewidths of 900 and I 175 Hz for the (±3/2, ±1/2) and (±5/2, ±3/2) transitions. respectively. HANS J. JAKOBSEN, JORGEN SKIBSTED, HENRIK BILDSBE, ANDNIELS CHR .NIELSEN,JMR 85,173(1989)
51V MAS (HQ+HCSA) Question: is it possible to suppress the sidebands of a satellite transition MAS spectrum? “Answer”: Not done yet, but it’s an interesting topic.
Direct Dipole-Dipole Coupling ~80 kHz Many coupled spins Spin Pair
Homogeneous Interaction (Homonuclear Dipolar Interaction):All Spins Are Coupled to Each Other
Decoupling Sequences • Hetronuclear decoupling: CW TPPM XiX COMORO SPINAL SDROOPY,eDROOPY,DUMBO, eDUMBO, eDUMBOlk • Homonuclear decoupling WAHUHA Lee-Goldburg (LG and variants: FSLG, PMLG,wPMLG) MREV-8 BR-24 BLEW-12 CORY-24 TREV-8 MSHOT-3 DUMBO, eDUMBO, eDUMBOlk, CNnv, RNnv