Download
1 / 19
190 likes | 363 Vues
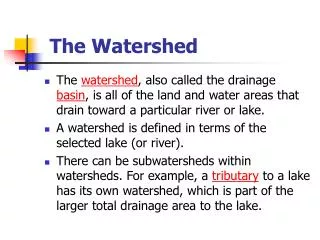
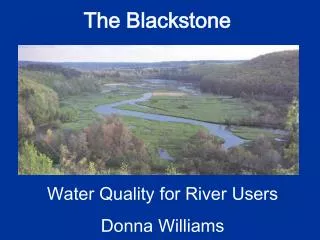
Blackstone River User’s Conference September 18, 2012. Phosphorous Loading in the Blackstone Watershed. Where does it come from And What can we do about it?. Peter Coffin, Coordinator, Blackstone River Coalition.

E N D
Blackstone River User’s Conference September 18, 2012 Phosphorous Loadingin the Blackstone Watershed Where does it come from And What can we do about it? Peter Coffin, Coordinator, Blackstone River Coalition
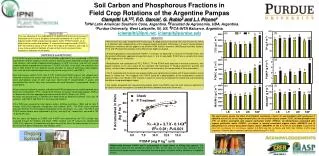
Regional and model export coefficient comparison for phosphorus in lbs/acre/year
Phosphorus Load (lb./ac/year) in Blackstone River Watershed from HSPF Model
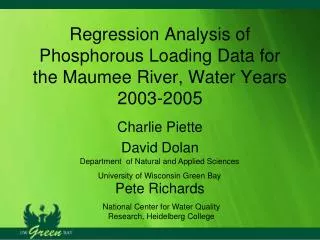
Overlay Phosporous Load Map on to Google Earth 30 meter pixels highlight Phosphorous Loads
Bioretention and rain gardens use plant and microbes in the practices to treat pollutant loads. These can range in removal efficiency of 30% to 90% (MA DEP).
Water Quality Swale (Image Source: Portland Bureau of Environmental Services) These are vegetated open channels to treat 10-year storms (MADEP). Pollutant removal efficiency is 20% to 90% for phosphorus.