Function-Oriented Software Design (lecture 5)
Function-Oriented Software Design (lecture 5). Dr. R. Mall. Organization of this Lecture. Brief review of last lecture Introduction to function-oriented design Structured Analysis and Structured Design Data flow diagrams (DFDs)

Function-Oriented Software Design (lecture 5)
E N D
Presentation Transcript
Function-Oriented Software Design (lecture 5) Dr. R. Mall
Organization of this Lecture • Brief review of last lecture • Introduction to function-oriented design • Structured Analysis and Structured Design • Data flow diagrams (DFDs) • A major objective of this lecture is that you should be able to develop DFD model for any problem. • Examples • Summary
Review of last lecture • Last lecture we started • with an overview of activities carried out during the software design phase. • We identified different information that must be produced at the end of the design phase: • so that the design can be easily implemented using a programming language.
Review of last lecture • We characterized the features of a good software design by introducing the concepts: • cohesion, coupling, • fan-in, fan-out, • abstraction, etc. • We classified different types of cohesion and coupling: • enables us to approximately determine the cohesion and coupling existing in a design.
Review of last lecture • There are two fundamentally different approaches to software design: • function-oriented approach • object-oriented approach • We looked at the essential philosophy of these two approaches: • the approaches are not competing but complementary approaches.
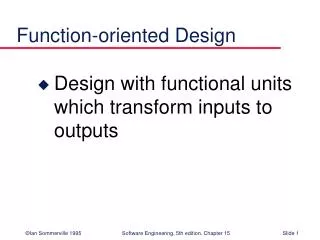
Introduction • Function-oriented design techniques are very popular: • currently in use in many software development organizations. • Function-oriented design techniques: • start with the functional requirements specified in the SRS document.
Introduction • During the design process: • high-level functions are successively decomposed: • into more detailed functions. • finally the detailed functions are mapped to a module structure.
Introduction • Successive decomposition of high-level functions: • into more detailed functions. • Technically known as top-down decomposition.
Introduction • SA/SD methodology: • has essential features of several important function-oriented design methodologies --- • if you need to use any specific design methodology later on, • you can do so easily with small additional effort.
SA/SD (Structured Analysis/Structured Design) • SA/SD technique draws heavily from the following methodologies: • Constantine and Yourdon's methodology • Hatley and Pirbhai's methodology • Gane and Sarson's methodology • DeMarco and Yourdon's methodology • SA/SD technique can be used to perform • high-level design.
Overview of SA/SD Methodology • SA/SD methodology consists of two distinct activities: • Structured Analysis (SA) • Structured Design (SD) • During structured analysis: • functional decomposition takes place. • During structured design: • module structure is formalized.
Functional decomposition • Each function is analyzed: • hierarchically decomposed into more detailed functions. • simultaneous decomposition of high-level data • into more detailed data.
Structured analysis • Transforms a textual problem description into a graphic model. • done usingdata flow diagrams (DFDs). • DFDs graphically represent the results of structured analysis.
Structured design • All the functions represented in the DFD: • mapped to a module structure. • The module structure: • also called as the software architecture:
Detailed Design • Software architecture: • refined through detailed design. • Detailed design can be directly implemented: • using a conventional programming language.
Structured Analysis vs. Structured Design • Purpose of structured analysis: • capture the detailed structure of the system as the user views it. • Purpose of structured design: • arrive at a formthat is suitable for implementation in some programming language.
Structured Analysis vs. Structured Design • The results of structured analysis can be easily understood even by ordinary customers: • does not require computer knowledge • directly represents customer’s perception of the problem • uses customer’s terminology for naming different functions and data. • The results of structured analysis can be reviewed by customers: • to check whether it captures all their requirements.
Structured Analysis • Based on principles of: • Top-down decomposition approach. • Divide and conquer principle: • each function is considered individually (i.e. isolated from other functions) • decompose functions totally disregarding what happens in other functions. • Graphical representation of results using • data flow diagrams (or bubble charts).
Data flow diagrams • DFD is an elegant modelling technique: • useful not only to represent the results of structured analysis • applicable to other areas also: • e.g. for showing the flow of documents or items in an organization, • DFD technique is very popular because • it is simple to understand and use.
Data flow diagram • DFD is a hierarchical graphical model: • shows the different functions (or processes) of the system and • data interchange among the processes.
DFD Concepts • It is useful to consider each function as a processing station: • each function consumes some input data and • produces some output data.
Data Flow Model of a Car Assembly Unit Engine Store Door Store Chassis with Engine Partly Assembled Car Fit Doors Fit Wheels Paint and Test Fit Engine Assembled Car Car Chassis Store Wheel Store
Data Flow Diagrams (DFDs) • A DFD model: • uses limited types of symbols. • simple set of rules • easy to understand: • it is a hierarchical model.
Hierarchical model • Human mind can easily understand any hierarchical model: • in a hierarchical model: • we start with a very simple and abstract model of a system, • details are slowly introduced through the hierarchies.
How does the human mind work? (Digression) search store
How does the human mind work? (Digression) • Short term memory can hold upto 7 items: • In Software Engineering the number 7 is called as the magic number. • An item is any set of related information (called a chunk): • an integer • a character • a word • a story • a picture, etc
How does the human mind work? (Digression) • To store 1,9,6,5 requires 4 item spaces: • but requires only one storage space when I recognize it as my year of birth. • It is not surprising that large numbers:: • usually broken down into several 3 or 4 digit numbers • e.g. 61-9266-2948
Data Flow Diagrams (DFDs) • Primitive Symbols Used for Constructing DFDs:
External Entity Symbol • Represented by a rectangle • External entities are real physical entities: • input data to the system or • consume data produced by the system. • Sometimes external entities are called terminator, source, or sink. Librarian
Function Symbol • A function such as “search-book” is represented using a circle: • This symbol is called a processor bubbleor transform. • Bubbles are annotated with corresponding function names. • Functions represent some activity: • function names should be verbs. search-book
Data Flow Symbol book-name • A directed arc or line. • represents data flow in the direction of the arrow. • Data flow symbols are annotated with names of data they carry.
Data Store Symbol • Represents a logical file: • A logical file can be: • a data structure • a physical file on disk. • Each data store is connected to a process: • by means of a data flow symbol. book-details
Data Store Symbol find-book • Direction of data flow arrow: • shows whether data is being readfrom or written into it. • An arrow into or out of a data store: • implicitly represents the entire data of the data store • arrows connecting to a data store need not be annotated with any data name. Books
Output Symbol • Output produced by the system
Synchronous operation • If two bubbles are directly connected by a data flow arrow: • they are synchronous Read-numbers0.1 Validate-numbers0.2 number Valid number Data-items
Asynchronous operation • If two bubbles are connected via a data store: • they are not synchronous. Read-numbers0.1 Validate-numbers0.2 numbers Valid number Data-items
Yourdon's vs. Gane Sarson Notations • The notations that we would be following are closer to the Yourdon's notations • You may sometimes find notations in books that are slightly different • For example, the data store may look like a box with one end closed
How is Structured Analysis Performed? • Initially represent the software at the most abstract level: • called the context diagram. • the entire system is represented as a single bubble, • this bubble is labelled according to the main function of the system.
Tic-tac-toe: Context Diagram Tic-tac-toe software display move Human Player
Context Diagram • A context diagram shows: • data input to the system, • output data generated by the system, • external entities.
Context Diagram • Context diagram captures: • various entities external to the system and interacting with it. • data flow occurring between the system and the external entities. • The context diagram is also called as the level 0 DFD.
Context Diagram • Context diagram • establishes the context of the system, i.e. • represents: • Data sources • Data sinks.
Level 1 DFD • Examine the SRS document: • Represent each high-level function as a bubble. • Represent data input to every high-level function. • Represent data output from every high-level function.
Higher level DFDs • Each high-level function is separately decomposed into subfunctions: • identify the subfunctions of the function • identify the data input to each subfunction • identify the data output from each subfunction • These are represented as DFDs.
Decomposition • Decomposition of a bubble: • also called factoring or exploding. • Each bubble is decomposed to • between 3 to 7 bubbles.
Decomposition • Too few bubbles make decomposition superfluous: • if a bubble is decomposed to just one or two bubbles: • then this decomposition is redundant.
Decomposition • Too many bubbles: • more than 7 bubbles at any level of a DFD • make the DFD model hard to understand.
Decompose how long? • Decomposition of a bubble should be carried on until: • a level at which the function of the bubble can be described using a simple algorithm.
Example 1: RMS Calculating Software • Consider a software called RMS calculating software: • reads three integers in the range of -1000 and +1000 • finds out the root mean square (rms) of the three input numbers • displays the result.