Downregulation of miRNAs in Hyperdiploid Multiple Myeloma Resembles Oncogenic IgH Translocations
This study explores the downregulation of specific microRNAs (miRNAs) in hyperdiploid multiple myeloma (MM) and how these changes mimic the oncogenic effects of IgH translocations observed in non-hyperdiploid MM. Through advanced microarray analyses and bisulfite sequencing, we identify significant shifts in miRNA expression and methylation patterns. Our findings suggest a potential link between miRNA regulation and the pathogenesis of hyperdiploid MM, raising the prospect of new therapeutic strategies targeting these molecular pathways.

Downregulation of miRNAs in Hyperdiploid Multiple Myeloma Resembles Oncogenic IgH Translocations
E N D
Presentation Transcript
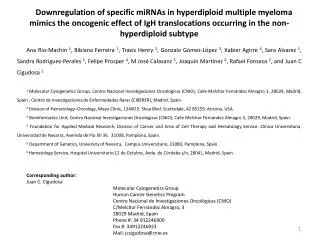
Downregulation of specific miRNAs in hyperdiploid multiple myeloma mimics the oncogenic effect of IgH translocations occurring in the non-hyperdiploid subtype • Ana Rio-Machin 1, Bibiana Ferreira1, Travis Henry 2, Gonzalo Gómez-López 3, Xabier Agirre 4, Sara Alvarez 1, Sandra Rodriguez-Perales 1, Felipe Prosper 4, M José Calasanz 5, Joaquín Martínez 6, Rafael Fonseca 2, and Juan C Cigudosa 1 • 1 Molecular Cytogenetics Group, Centro Nacional Investigaciones Oncologicas (CNIO), Calle Melchor Fernández Almagro 3, 28029, Madrid, Spain ; Centro de Investigaciones de Enfermedades Raras (CIBERER), Madrid, Spain. • 2 Division of Hematology–Oncology, Mayo Clinic, 13400 E. Shea Blvd. Scottsdale, AZ 85259, Arizona, USA. • 3 Bioinformatics Unit, Centro Nacional Investigaciones Oncologicas (CNIO), Calle Melchor Fernández Almagro 3, 28029, Madrid, Spain. • 4 Foundation for Applied Medical Research, Division of Cancer and Area of Cell Therapy and Hematology Service, Clínica Universitaria, Universidad de Navarra, Avenida de Pío XII 36, 31008, Pamplona, Spain. • 5 Department of Genetics, University of Navarra, Campus Universitario, 31080, Pamplona, Spain. • 6 Hematology Service, Hospital Universitario 12 de Octubre, Avda. de Córdoba s/n, 28041, Madrid, Spain. • Corresponding author: • Juan C. Cigudosa • Molecular Cytogenetics Group • Human Cancer Genetics Program • Centro Nacional de Investigaciones Oncológicas (CNIO) • C/Melchor Fernández Almagro, 3 • 28029 Madrid, Spain • Phone #: 34 912246900 • Fax #: 34912246923 • Mail: jccigudosa@cnio.es
Supplementaryinformationsummary: TABLES: Supplementary Table 1: Description of the samples: their clinical origin and use in this work. Supplementary Table 2: Cytogenetic and clinicalcharacteristics of theevaluatedpatients in themiRNAsmicroarray. Supplementary Table 3: Sequence of theprimersusedforthe bisulphite sequencing. Supplementary Table 4: Locations of themiRNAsconsensusbindingsites in the 3’UTR regions of theselected target genes. Supplementary Table 5: Microarray supervised analysis : significantlydifferentiallyexpressedmiRNAs. Supplementary Table 6: Predicted Target Genes that are overexpressed in h-MM vs nh-MM (FDR<0.01 ) FIGURES: Supplementary Figure 1: Validation II. Supplementary Figure 2: Methylation status of hsa-miR-152 and hsa-miR339. Supplementary Figure 3: Luciferase assay. Supplementary Figure 4: Complete Western Blot gel images of Figure 2B. Supplementary Figure 5: Densitometric analysis I. Supplementary Figure 6: OH-2 cell line. Supplementary Figure 7: Densitometric analysis II. Supplementary Figure 8: Target genes and miRNAs expression in MM cases.
Supplementary Table 1. Description of the samples: their clinical origin and use in this work
Supplementary Table 2. Cytogenetic and clinicalcharacteristics of theevaluatedpatients in themiRNAsmicroarray
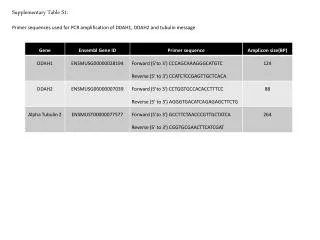
Supplementary Table 3. Sequence of theprimersusedforthe bisulphite sequencing
Supplementary Table 4. Locations of themiRNAsconsensusbindingsites in the 3’UTR regions of theselected target genes.
Supplementary Table 5. Microarray supervised analysis : significantlydifferentiallyexpressedmiRNAs (FDR < 0.05)
Supplementary Figure 1: miRNA EXPRESSION IN THE VALIDATION SERIES *** * < 0,05 ** < 0,01 *** < 0,001 *** *** nh-MM h-MM *** *** Supplementary Figure 1: Validation II. Expression levels of the selected miRNAs in a different series of nh-MM cases and h-MM cases were assessed by real-time PCR. The result of the microarray was validated again.
Supplementary Figure 2: hsa-miR-152 hsa-miR-339 CpG 10 CpG 11 CpG 12 CpG 13 CpG 14 CpG 15 CpG 16 CpG 17 CpG 1 CpG 2 CpG 3 CpG 4 CpG 5 CpG 6 CpG 7 CpG 8 CpG 9 + control + control CpG 11 CpG 6 CpG 4 CpG 3 CpG 8 CpG 1 CpG 2 CpG 10 CpG 5 CpG 9 CpG 7 Non-Hyperdiploid MM cases Non-Hyperdiploid MM cases Hyperdiploid MM cases Hyperdiploid MM cases Supplementary Figure 2: Methylation status of hsa-miR-152 and hsa-miR339. Bisulphite sequencing of the hsa-miR-339 and hsa-miR-152 CpG island regions in positive methylated control (+ control) and 18 MM cases (10 nh-MM and 8 h-MM cases). Each circle indicates a CpG dinucleotide (black circle: methylated CpG; open circle: unmethylated CpG). Methylation of the promoter region of miR152 seems not be demonstrated in the primary samples, and, although the miR339 promoter shows methylated CpGs, no clear differences are seen when we compare the two MM subtypes.
Supplementary Table 6. PredictedTarget Genes that are overexpressed in h-MM vs nh-MM (FDR<0.001 ) usingexpression dataset provided by Chnget al. 2007 (miRanda (miRBase v12.0) and TargetScan v 5.1) hsa-miR-152 hsa-let-7 hsa-miR-339 hsa-miR-425 hsa-miR-24 hsa-miR-125a
Supplementary Table 7. PredictedTarget Genes that are overexpressed in h-MM vs nh-MM (FDR<0.001 ) usingexpression dataset provided by Agnelliet al. 2007 (miRanda (miRBase v12.0) and TargetScan v 5.1) hsa-let-7 hsa-miR-24 hsa-miR-152 hsa-miR-425 hsa-miR-339 hsa-miR-125a
Supplementary Figure 3: LUCIFERASE ASSAY Supplementary Figure 3: Luciferase assay. The empty reporter plasmid (empty pGL3 luciferase vector) or the luciferase constructs containing, respectively, a wild-type and a mutated 3’UTR regions of the selected target genes (TACC3, CCND1, FGFR3 and MAFB) were co-transfected into Hela cells with the miRNA vectors (pMSCV-425, pMSCV-24, pMSCV-152 and scramble miRNA) and together with Renilla vector for normalization. Luciferase activity was determined 48 h after reporter plasmid transfection in all cases. The reduction in luciferase activity induced by the three miRNAs expression was observed in each case, allowing us to demonstrate that MAFB1, CCND1 and FGFR3 are real targets of hsa-miR-152, hsa-miR-425 and hsa-miR-24, respectively. . Data are presented as mean from four separate experiments with n = 3 for each experiment. Error bars represent Standard error of the mean (SEM)
Supplementary Figure 4: U266 + hsa-miR-152 U266 SCR 48h 72h 24h MAFB 43kDa α- Tubulin 55 kDa U266 + hsa-miR-425 U266 SCR 48h 72h 24h Cyclin D1 38 kDa 55 kDa α- Tubulin U266 + hsa-miR-425 U266 SCR 48h 72h 24h TACC3 140 kDa Supplementary Figure 4: Complete Western Blot gel images of Figure 2B. As shown, the signals from Scrtransfected cells correspond to the same set of experiments. α- Tubulin 55 kDa U266 + hsa-miR-24 U266 SCR 48h 72h 24h FGFR3 135 kDa GAPDH 38 kDa
Supplementary Figure 5: Densitometric analysis. The target protein expression was quantified by densitometric analysis carried out using the ImageJ software on images acquired from the results of Western blotting (Figure 2B). The analysis shows the percentage of decrease in Tacc3, Cyclin D1 and MafBexpression after the overexpression of the corresponding miRNAs (hsa-miR-425, hsa-miR-425 and hsa-miR-24, respectively) in U266 cells over cells transfected with scramble miRNA vector and normalized with the GAPDH or α-tubulin protein expression used as loading control.Data are presented as mean from three separate experiments. Error bars represent Standard error (SE).
Supplementary Figure 6: Supplementary Figure 6: OH-2 cell line. Expression levels of the selected miRNAs in the h-MM cell line OH-2 were assessed by real-time PCR. We were able to show the downregulation of the three miRNAs in the OH-2 cell line, as occurs in h-MM patients. In both (A) and (B)data are expressed as 2-∆Ct values obtained by normalization using RNU19 as endogenous control. Error bars represent SD.
Supplementary Figure 7: Densitometric analysis. The target protein expression was quantified by densitometric analysis carried out using the ImageJ software on images acquired from the results of Western blotting (Figure 3B). The analysis shows the entity of increase in Tacc3, Cyclin D1, Fgfr3 and MafB expression at 48h or 72h after the inhibition of the corresponding miRNAs (hsa-miR-425, hsa-miR-24 and hsa-miR-152, respectively) in Hela or 293FT cells. The results were normalized with the GAPDH protein expression used as loading control and were expressed as percentage of the protein expression in the cells transfected with miRIDIAN control vector. Data are presented as mean from three separate experiments. Error bars represent SEM.
Supplementary Figure 8: hsa-miR-425 TACC3 nh-MM patients h-MM patients CD138+ cells CCND1 hsa-miR-152 MAFB FGFR3 hsa-miR-24
Supplementary Figure 8: Target genes and miRNAs expression in MM cases . (Extension of Figure 3B and 3C) Error bars represent SD.
Supplementary Table 8: Publicly available gene and miRNA expression data on multiple myeloma (MM).