Supplementary Information
Supplementary Information The latent origin of replication of Epstein-Barr virus directs viral genomes to active regions of the nucleus Manuel J. Deutsch, Elisabeth Ott, Peer Papior, and Aloys Schepers* Department of Gene Vectors HelmholtzZentrum muenchen Marchioninistrasse 25 81377 Munich

Supplementary Information
E N D
Presentation Transcript
Supplementary Information The latent origin of replication of Epstein-Barr virus directs viral genomes to active regions of the nucleus Manuel J. Deutsch, Elisabeth Ott, Peer Papior, and Aloys Schepers* Department of Gene Vectors HelmholtzZentrum muenchen Marchioninistrasse 25 81377 Munich Germany *Corresponding Author: Aloys Schepers Phone: 0049 89 7099509 FAX: 0049 89 7099225 e-mail: schepers@helmholtz-muenchen.de
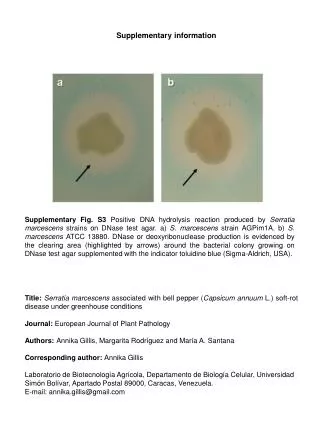
A B HEK293 EBV+ C D Supplementary Figure S1 The interaction domain between the dense chromatin (CD) and the interchromatin compartment (IC) defines the perichromatin (PC). A) DAPI DNA counterstain of HEK293 EBV+ cells after incubation in isotonic buffer. B) DAPI DNA counterstain of hypertonically treated HEK293 EBV+ displaying characteristic condensation of the chromatin. C) enlarged single cell from B) D) enlarged section of C) indicating the condensed chromatin or chromatic domain (CD), the enlarged nuclear travelling channels of the interchromatin domain (IC) and the interaction zone of the CD and IC, the perichromatic domain (PC) depicted in a red line. Enlargements are indicated as white-lined squares. Scale bar = 2 µm. Figure S1
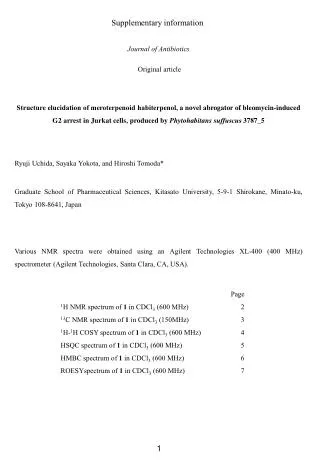
D A HEK293 EBV+ peaks overlap greyscale value greyscale value hypertone = colocalization B Distance in µm Distance in µm Raji greyscale value Distance in µm shoulders overlap hypertone = association C LCL2908 wt-oriP peaks are separated = not associated hypertone 206 178 177 118 118 137 59,2 68,7 58,9 greyscale value greyscale value greyscale value 0 0 0 3,88 1,27 2,42 7,76 4,83 2,53 3,8 7,25 11,6 distance in µm distance in µm distance in µm Supplementary Figure S2 Signal-intensity scans of EBV (red) and DNA-counterstain (blue) along the indicated line in HEK293-EBV+(A), Raji (B) and LCL2908 cells (C). Localization of EBV is not observed in the peaks of the DNA-counterstain but next to it, indicating perichromatic localisation. Scale bar = 2µm. (D) Peak classification. (top) Signals that show a complete overlap were classified as colocalizing. (middle) Signals that show overlaping shoulders but no but no complete overlap were classified as associated. (bottom) Signals that show no overlapping intensities were classified as non-associated. Figure S2
A Raji H3K4me3 3D-reconstruction B Raji H3K9me3 3D-reconstruction turned 172° along x-axis C Raji H3K27me3 3D-reconstruction D Raji H3K9ac 3D-reconstruction Figure S3 - Part 1
E I H3K4me3 greyscale value greyscale value F Distance in µm Distance in µm greyscale value Distance in µm H3K9me3 shoulders overlap G = association peaks overlap peaks are separated = colocalization = not associated H3K27me3 H 220 214 220 220 147 147 143 147 73,3 71,3 73,3 73,3 greyscale value greyscale value greyscale value greyscale value H3K9ac 0 0 0 0 2,1 2,16 3,51 2,19 4,31 4,2 7,02 4,37 10,5 6,3 6,55 6,47 distance in µm distance in µm distance in µm distance in µm Raji Raji Raji Raji Figure S3 - Part 2
Supplementary Figure S3 Raji-cells after combined immunofluorescence and fluorescence in situ hybridization. EBV-genomes were visualized by FISH using an EBV-specific probe (red). Colocalization with histone3 trimethylated at lysine 4 (H3K4me3; first panel) (A), histone3 trimethylated at lysine 9 (H3K9me3; second panel) (B), histone3 trimethylated at lysine 27 (H3K27me3; third panel) (C), and histone3 acetylated at lysine 9 (H3K9ac; fourth panel) (D) are shown in green. The cells outlined with white-lined squares were 3D-reconstructed for localization analysis. Reconstruction image of H3K9me3 has been rotated 172° along its x-axis for better understanding. (E-H) Signal-intensity scans of the respective histone modifications (green; channel 1), EBV (red; channel 0) and DNA-counterstain (blue; channel 2) along the indicated line in Raji-cells. EBV-peaks colocalize with peaks for H3K4me3 (E) and H3K9ac (H). Colocalization occurs not with the peaks of H3K9me3 (F) and only sporadically with H3K27me3 (H). Scale bar = 2 µm. (I) Peak classification. (top) Signals that show a complete overlap were classified as colocalizing. (middle) Signals that show overlaping shoulders but no but no complete overlap were classified as associated. (bottom) Signals that show no overlapping intensities were classified as non-associated.
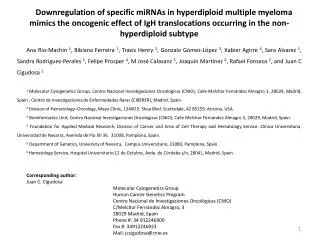
A 2800 2908 2910 D DS 2912eFR 2913eDS .3 .4 .I .II .4 .XI .XII .4 .II .XII clone ID oriP translocated size (kbp) 9,2 5,8 5,6 10,0 and 5,4 10,7 and 4,5 enzyme XhoI BamHI clone ID B 2913eDS: PCR Analysis 2908 H2O M .4 .II .XII 280 bp 160 bp Supplementary Figure S4 The correctness of the different mini-EBV-mutants the LCLs resulting from the infection experiments were analyzed by Southern blot hybridization and PCR. A) Genomic DNA of LCL subclones was digested with the indicated restriction enzyme. The hybridization probe detected oriP-fragments. The expected sizes of the fragments at the oriP and ectopic integration site are given below. B) The DS-fragment translocated to the ectopic site is not easily detected by Southern blotting. Therefore, we confirmed the integrity of the translocated DS-fragment by PCR using a primer pair that encompasses the integration site. Successful integration was indicated by a shift from 160 bp to 280 bp. Figure S4
A LCL2908 wt-oriP hypertone 3D-reconstruction B LCL2910-DS hypertone 3D-reconstruction C HEK293-2912eFR hypertone 3D-reconstruction D LCL2913eDS hypertone 3D-reconstruction Figure S5 - Part1
E LCL2908 wt-oriP hypertone F LCL2910-DS hypertone G HEK293-2912eFR hypertone H LCL2913eDS 172 177 198 211 145 132 138 135 66,4 58,9 57,5 70,4 greyscale value greyscale value greyscale value greyscale value 0 0 0 0 3,13 2,59 2,44 2,58 5,12 5,18 4,89 6,27 7,68 9,4 7,33 7,76 hypertone distance in µm distance in µm distance in µm distance in µm Figure S5 - Part2
Supplementary Figure S5 Lymphoblast-cells after combined immunofluorescence and fluorescence in situ hybridization. Cells were infected with a mini-EBV-genome lacking the lytic genes of EBV; EBV genomic DNA (red), EBNA1 (green) and DNA (blue); EBV and EBNA1 are colocalizing in the chromatin-poorer regions of the nucleus. A) Perichromatic localization is revealed by the hypertonic treatment of cells carrying a mini-EBV-genome with wild-type oriP (2908 wt-oriP). B) Deletion of the dyad symmetry element (DS) of oriP (2910DDS) does not lead to a deviation of the EBV:EBNA1-colocalisation in perichromatin. The alteration of the spatial integrity of oriP by translocating either the family of repeats (FR) (2912eFR; C) or, the dyad symmetry element (DS) (2913eDS; D) does neither affect the EBV:EBNA1-colocalisation nor the perichromatic localization of the EBV-genomes. (E-H) Signal-intensity scans for EBNA1 (green; channel 1), Mini-EBV-genomes (red; channel 0) and DNA-counterstain (blue; channel 2) along the indicated line in the respective LCLs. EBV-peaks colocalize with peaks for EBNA1. Colocalization does not occurr in the peaks of the DNA-counterstain, but next to it, indicating perichromatic localization. Scale bar = 2 µm.
A LCL2908 wt-oriP H3K4me3 B H3K9me3 C H3K27me3 220 220 220 147 147 147 73,3 73,3 73,3 greyscale value greyscale value greyscale value 0 0 0 7,68 1,32 1,75 15,4 2,65 3,51 23 3,97 5,26 distance in µm distance in µm distance in µm Figure S6 - Part1
D LCL2910-DS H3K4me3 E H3K9me3 F H3K27me3 220 220 174 116 147 147 73,3 73,3 58,1 greyscale value greyscale value greyscale value 0 0 0 1,27 1,09 1,58 3,16 2,53 2,19 3,8 3,28 4,74 distance in µm distance in µm distance in µm Supplementary Figure S6 Lymphoblast-cells LCL2908 wt-oriP A)-C) and LCL2910 ∆DS D)-F) after combined immunofluorescence and fluorescence in situ hybridization. EBV-genomes were visualized by FISH using an EBV-specific probe (red). Colocalization with histone3 trimethylated at lysine 4 (H3K4me3) (A+D), histone3 trimethylated at lysine 9 (H3K9me3) (B+E) and histone3 trimethylated at lysine 27 (H3K27me3) (C+F) are shown in green.Signal-intensity scans of the respective histone modifications (green), EBV (red) and DNA-counterstain (blue) along the indicated line in the respective cells. EBV-peaks colocalize with peaks for H3K4me3. Colocalization occurs rarely with the peaks of H3K9me3. Colocalization with H3K27me3 is increased in LCL2910∆DS. Scalebar = 2 µm. Figure S6 - Part2