Electronic Supplementary Information
640 likes | 769 Vues
This study presents the synthesis and evaluation of fluorescent cap analogues intended for mRNA labeling. It analyzes the effect of solvent polarity on the spectroscopic properties of methyl anthranilate (AntOMe) and methyl-N-methylanthranilate (MantOMe). The research finds that absorption maxima shifts and fluorescence intensity variations depend on solvent properties, with quantum yields in alcohol solutions being significantly higher than in phosphate buffer. Time-resolved experiments indicate longer fluorescence lifetimes in less polar solvents. Detailed spectroscopic data and analysis are included.

Electronic Supplementary Information
E N D
Presentation Transcript
Electronic SupplementaryInformation Synthesis and evaluation of fluorescent cap analogues for mRNA labelling Marcin Ziemniaka, Mariusz Szabelskib, Maciej Lukaszewicza, Anna Nowickaa, Edward Darzynkiewicza, Robert E. Rhoadsc, Zbigniew Wieczorekb, Jacek Jemielitya,d*. a Division of Biophysics, Institute of Experimental Physics, Faculty of Physics, University of Warsaw, ZwirkiiWigury 93, 02-089 Warsaw, Poland b Department of Physics and Biophysics, University of Warmia and Mazury in Olsztyn, Oczapowskiego 4, 10-719 Olsztyn, Poland c Department of Biochemistry and Molecular Biology, Louisiana State University Health Sciences Center, Shreveport, Louisiana 71130-3932, USA d Centre of New Technologies, University of Warsaw, ZwirkiiWigury 93, 02-089 Warsaw, Poland
Data presented in Table S1 illustrates effect of polarity of different solvents on the spectroscopic properties of AntOMe and MantOMe. In this study MeOH, EtOH and iPrOH were chosen as appropriate organic solvents since theirs protic properties and dipole moments provide a close resemblance to water. Despite that absorption maxima and absorption coefficients displays only a slightly variation upon a change of solvent in case of AntOMe a 9 nm shift on changing from PBS to organic solvents was observed. Interestingly, fluorescence of AntOMe and MAntOMe decreases in intensity and is red shifted with increasing solvent polarity. Quantum yields calculated for alcohol solutions are almost five times higher than in phosphate buffer solutions. Time-resolved experiments revealed a tendency to increase fluorescence lifetime if solvent polarity is decreased. The most significant changes were observed for AntOMe as its lifetime in aqueous medium (PBS, pH 5.175) was equal 1.81 ns, however, in ethanol it was prolonged to 8.25 ns (Table S1.).
Table S1. Spectroscopic properties of methyl anthranilate and methyl N-methylanthranilate in phosphate buffer and organic solvents.
Fig. S1. Absorbance and emission spectra of AntOMe Fig. S2. Absorbance and emission spectra of MantOMe
Fig. S4. Changes of fluorescenceintensity of Mant-m7GpppGand Trpresidues in eIF4E upon complexformation. The excitationwavelengthused in the experiment was 280 nm (maximum absorbtion for Trpresidues). eIF4Econcentration was 100 nM and Mant-m7GpppG concentration was 200 nM. • Fig. S3. MantOMe fluorescence intensity observed upon addition of increasingamounts of eIF4E protein. The concentration of MantOMe was 200 nM and the eIF4E concentrations were in range 50-1000 nM.
Table S2. 1H NMR signals of 2' and 3' regioisomers of cap analogues 1-2
Table S3. Conformational and regioisomericequilibria for some (M)Ant labelled nucleotides
Ant-m7GpppG isomer C2’ 29% isomer C3’ 64% 7% HPLC profile
Ant-m7GpppG λ (nm) Emission spectrum
Ant-m7GpppG λ (nm) Absorption spectrum
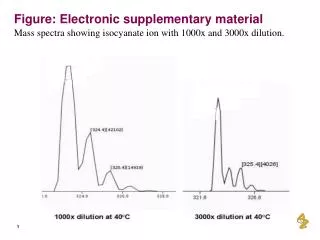
Ant-m7GpppG ESI (-) MS
Ant-m7GpppG 1H NMR
Ant-m7GpppG 31P NMR
Mant-m7GpppG isomer C3’ 60% isomer C2’ 40% HPLC profile
Mant-m7GpppG λ (nm) Emission spectrum
Mant-m7GpppG λ (nm) Absorption spectrum
Mant-m7GpppG ESI (-) MS
Mant-m7GpppG 1H NMR
Mant-m7GpppG 31P NMR
Mant-m7GpCH2ppG isomer C2’ 34% isomer C3’ 50% 4% 7% 5% HPLC profile
Mant-m7GpCH2ppG λ (nm) Emission spectrum
Mant-m7GpCH2ppG λ (nm) Absorption spectrum
Mant-m7GpCH2ppG ESI (-) MS
Mant-m7GpCH2ppG 1H NMR
Mant-m7GpCH2ppG 31P NMR
Mant-m7GppCH2pG isomer C3’ 63% isomer C2 31% 6% HPLC profile
Mant-m7GppCH2pG λ (nm) Emission spectrum
Mant-m7GppCH2pG λ (nm) Absorption spectrum
Mant-m7GppCH2pG ESI (-) MS
Mant-m7GppCH2pG 1H NMR
Mant-m7GppCH2pG 31P NMR
Ant-m27,2’-OGpppG 100% HPLC profile
Ant-m27,2’-OGpppG λ (nm) Emission spectrum
Ant-m27,2’-OGpppG λ (nm) Absorption spectrum
Ant-m27,2’-OGpppG ESI (-) MS
Ant-m27,2’-OGpppG 1H NMR
Ant-m27,2’-OGpppG 31P NMR
Ant-m7GDP isomer C3’ isomer C2’ HPLC profile
Ant-m7GDP λ (nm) Emission spectrum
Ant-m7GDP λ (nm) Absorption spectrum
Ant-m7GDP ESI (-) MS
Ant-m7GDP 1H NMR
Ant-m7GDP 31P NMR
Mant-m7GDP isomer C3’ isomer C2’ HPLC profile
Mant-m7GDP ESI (-) MS
Mant-m7GDP λ (nm) Emission spectrum
Mant-m7GDP λ (nm) Absorption spectrum