Download
1 / 19
190 likes | 216 Vues
This study investigates how cytosolic PKM2 enhances mutant EGFR stability through HSP90-EGFR interaction, impacting lung cancer progression. The researchers utilized various techniques including real-time RT–PCR, apoptosis assays, and immunohistochemistry analyses to examine the molecular mechanisms involved. Additionally, plasmids containing different EGFR mutants were used, along with shRNA constructs targeting EGFR and PKM2. The findings suggest a novel role for PKM2 in regulating mutant EGFR levels, potentially influencing tumor growth in lung cancer.

E N D
Supplementary Information Cytosolic PKM2 stabilizes mutant EGFR protein expression through regulating HSP90-EGFR association Yi-Chieh Yang1, Tsu-Yao Cheng2, Sin-Ming Huang3, Chia-Yi Su4, Pei-Wen Yang5, Jang-Ming Lee5, Chi-Kuan Chen3,4, Michael Hsiao4, Kuo-Tai Hua3, Min-Liang Kuo3,6 1Graduate Institute of Oncology, National Taiwan University Medical College; 2Department of Laboratory Medicine, National Taiwan University Hospital; 3Graduate Institute of Toxicology, National Taiwan University Medical College; 4Genomics Research Center, Academia Sinica; 5Department of Surgery, National Taiwan University Hospital; 6Graduate Institute of Biochemical Sciences, College of Life Science Sciences National Taiwan University, Taipei, Taiwan. The authors have declared that no conflict of interest exists. Supplementary Figures 1-7 and Supplemental Tables 1-3
Supplementary Methods Reagents GAPDH (Abcam, ab8245), PKM2 (Cell Signaling Technology, 4053), Lamin A/C (Santa Cruz Biotechnology, sc-7292), EGFR (Santa Cruz Biotechnology, sc-03), p-AKT (Santa Cruz Biotechnology, sc-7985-R), p-STAT3 (Cell Signaling Technology, 9145), p-ERK (Santa Cruz Biotechnology, sc-7383), Flag (Cell Signaling Technology, 8146), Myc (Sigma, M4439), HA (Santa Cruz, sc-805), p-EGFR (Santa Cruz Biotechnology, sc-12351), HSP90 (Cell Signaling Technology, 4877S), HOP (Abcam, ab126724), and p23 (Abcam, ab 92503). His-PKM2: Abcam, ab89364; GST-EGFR (wild type): GenWay Biotech, GWB-767301; GST-EGFR (L858R): GenWay Biotech, GWB-c7ea4f; His-HSP90α: GenWay Biotech, GWB-10202; His-HSP90β: GenWay Biotech, GWB-10342, Lambda Protein Phosphatase: (Cell Signaling Technology, P0753S). Real-time RT–PCR analysis Total RNA was extracted from the cells by using TRIzol (Invitrogen) according to the manufacturer's protocol and cDNA synthesis was carried out with iScript™ cDNA synthesis kit (Bio-Rad). The quantitative real time-PCR analysis was performed using KAPA SYBR FAST qPCR Kits (Kapa Biosystems) and StepOnePlus™ Real-Time PCR Systems (Applied Biosystems). Primer sequences are listed below. Myc: 5’-AAT GAA AAG GCC CCC AAG GTA GTT ATC C-3’ (forward), 5’-GTC GTT TCC GCA ACA AGT CCT CTT C-3’ (reverse); Bcl-XL: 5’-GAT CCC CAT GGC AGC AGT AAA GCA AG-3’ (forward), 5’-CCC CAT CCC GGA AGA GTT CAT TCA CT -3’ (reverse); CCND1: 5’-GCG TTG TAC CTG TAG GAC TCT-3’ (forward), 5’-GCT GGC TTC ATT GAG ATT TGG A-3’ (reverse); Bim: 5’-ATG GCA AAG CAA CCT TCT GA-3’ (forward), 5’-CTG TCT GTG TCA AAA GAG-3’ (reverse); PKM2: 5’-ATT ATT TGA GGA ACT CCG CCG CCT-3’ (forward), 5’-ATT CCG GGT CAC AGC AAT GAT GG-3’ (reverse); EGFR: 5’-TGA TAG ACG CAG ATA GTC GCC-3’ (forward), 5’-TCA GGG CAC GGT AGA AGT TG-3’ (reverse).
Apoptosis detection/Annexin V staining assay After indicated treatment, cells were collected and then processed by using Muse™ Annexin V & Dead Cell Assay kit (Merck Millipore) according to the manufacturer’s instructions. The amount of apoptotic cells was determined by a Muse automated cell analyzer (Merck Millipore). Immunohistochemistry analyses Formalin-fixed and paraffin-embedded tumor tissues were sectioned and processed for standard immunohistochemical staining procedures. Before antibody hybridization, the tumor sections were subjected to de-paraffinizing, rehydration and antigen retrieval. The primary antibodies for EGFR (1:200) and PKM2 (1:400) were used to detect the expression of EGFR and PKM2 in the tumor tissues. The percentage (0-100%) and intensity (0-3) of the staining were evaluated by a pathologist. Plasmids Plasmids bearing wild type-EGFR, exon19 deleted-EGFR, L858R-EGFR, FLAG-PKM2, R399E-PKM2, K433E-PKM2, and K367M-PKM2 were kind gifts from Dr. Zhimin Lu.17 The shRNA constructs against EGFR and PKM2 were purchased from National RNAi Core Facility. The target sequences were: sh-EGFR: GCC AAG CCA AAT GGC ATC TTT, sh-PKM2-1: GCT GTG GCT CTA GAC ACT AAA, sh-PKM2-2: CCA TAA TCG TCC TCA CCA A. sh-PKM2-3’UTR: CAA CGC TTG TAG AAC TCA CTC Cell proliferation assay and clonogenic assay Cells were trypsinized and seeded on 96-well plates at a density of 7,500 cells per well, and allowed to attach for 16h. After indicative treatments, cells were trypsinized and stained with trypan blue solution. Finally cells were transferred to the Hemocytometer and counted by microscope. Treated cells were seeded on 6-well plates at a density of 1,000 cells per well, and allowed to grow for 10 to 14 days. Colonies were fixed with 10% formalin, and then stained with crystal violet (0.5% w/v).
Supplemental Figure S1 a EGFR mutant EGFR wild-type PC9 H1975 HCC827 H1355 H157 A549 sh-PKM2 PKM2 GAPDH b H1355 (WT) H1975 (L858R, T790M) PC9 (Exon19del) 0.6 2.0 0.8 1.5 0.6 0.4 Tumor weight (g) Tumor weight (g) Tumor weight (g) 0.4 1.0 * ** ** ** 0.2 0.2 0.5 0.0 0.0 0.0 sh-control sh-control Gefitinib Gefitinib sh-PKM2-1 sh-control sh-PKM2-2 sh-PKM2-1 sh-PKM2-1 Supplementary Figure S1 Depletion of PKM2 in lung cancer cells. (a)Lysates from lung cancer cell lines after PKM2 depletion for 48 hours. (b) Infection with sh-PKM2 in PC9, H1975 (EGFR mutant), and H157 (EGFR wild type) cells inhibited tumor mass in NSG mice. Gefitinib treatment repressed the tumor mass in PC9 (sensitive), but not in H1975 (resistant) cells. *P<0.01, **P<0.001 versus control.
Supplemental Figure S2 U87 PC9 H1975 H1355 H157 a Nu Cyto Nu Nu Cyto Cyto Cyto Cyto Nu Nu EGF PKM2 Lamin A/C α-T PKM2 (long exp) b d H1355 H157 PC9 H1975 EGF p-EGFR (short exp) p-EGFR (long exp) GAPDH Cyto Nu c WT NES WT NES Nu (-) Nu (+) HA Lamin A/C α-T e PC9 H1975 sh-3’UTR-M2 HA-WT-M2 HA-K367M-M2 EGFR PKM2 HA GAPDH
H157 (WT) H1975 (Mut) f g sh-PKM1-1 sh-PKM1-2 sh-control sh-PKM2-96h sh-PKM2-96h sh-PKM2-72h sh-PKM2-72h sh-control sh-control EGFR PKM1 EGFR PKM2 PKM2 GAPDH GAPDH Supplementary Figure S2 PKM2 in EGFR signaling of lung cancer cells. (a) Nuclear and cytosolic PKM2 were detected by Western blotting with or without EGF treatment. Lamin A/C and α–tubulin were used as the internal control in the nucleus and cytosol. Cells were treated with 100 ng/ml EGF for 6 hours after 18 hours of serum starvation.(b)EGFR wild type (H1355, H157) and mutant (PC9, H1975) cells were treated with EGF for 15 minutes. Lysates were subjected to immunoblot assay.(c) Cell fractionation from H1975 cells transfected by HA-tagged wild type or NES PKM2. (d) The ratio of nuclear staining of PKM2 in lung cancer patients with wild type or mutant EGFR. Representative immunohistochemical PKM2 nuclear staining in lung cancer. Scale bar: 50 µm. (e) Reduction of EGFR protein levels by 3’-UTR targeting sh-PKM2 was rescued by restoring wild-type and kinase dead (K367M-) PKM2 in PC9 and H1975 cells. (f) EGFR were detected by Western blotting with sh-PKM2 for the indicated times in H157 and H1975 cells. (g) Lysates from PC9 cells with knockdown of PKM1 achieved by infection with sh-PKM1 lentivirus for 48 hours. Lysates were subjected to immunoblot assay.
Supplemental Figure S3 a b (h) CHX EX19del-EGFR sh-PKM2 µg Flag-WT-PKM2 EGFR EGFR 1 0.83 0.9 1 0.96 0.94 Flag PKM2 GAPDH GAPDH c EX19del-EGFR µg Flag-K367M-PKM2 EGFR DMSO-4h MG-132-4h MG-132-2h e DMSO-2h Flag GAPDH sh-PKM2 EGFR d PKM2 GAPDH L858R-EGFR µg ** * Flag-PKM1 1.0 EGFR 0.8 Flag 0.6 Fold Change of EGFR 0.4 GAPDH 0.2 0.0
Supplementary Figure S3 PKM2 modulates EGFR expression by protein regulation. (a) Lysates from H157 cells treated with cycloheximide to compare the degradation of wild type EGFR in the absence and presence of PKM2 of PKM2. 10µM cycloheximide was added and degradation was measured at indicated intervals from hours 0 to 12. (b and c) Transient ectopic expression of wild type (b) or kinase dead(c) PKM2 at the indicated dose of 0, 1, 3, and 5 µg promoted total EGFR expression in a dose-dependent manner in 293T cells. After glucose deprivation for 18 hours, the lysates were collected for immunoblot.(d)Transient ectopic expression of PKM1 at the indicated doses in 293T cells. (e) Inhibition of proteasome by 20µM MG-132 prevented degradation of L858R and T790M mutant EGFR after depletion of PKM2 in H1975 cells. *P<0.05, **P<0.01 versus PKM2 depletion.
Supplemental Figure S4 a H1975 H157 IP: IP: Input Input PKM2 IgG IgG PKM2 EGFR PKM2 EGFR PKM2 DAPI EGFR + PKM2 b d c IP: Flag Input IP: HA Input L858R-EGFR WT-EGFR HA-WT-PKM2 Flag-PKM1 HA-K367M-PKM2 Flag-PKM2 EGFR EGFR HA Flag f e IP: Flag Input Input IP: HA IP: Myc EGF HA-PKM2 WT-EGFR Myc-ECM Flag-WT Myc-ICM Flag-K433E EGFR Myc Flag HA
g h Input IP: HA HA-WT-PKM2 F-1,6-BP HA-PKM2 HA-R399E-PKM2 Myc-ICM-KA Myc-ICM-AP Tetramer ► IB: PKM2 Myc Dimer ► ◄ Light chain Monomer ► HA i j F-1,6-BP HA-WT-PKM2 Input IP: HA HA-R399E-PKM2 FBP HA-K305Q-PKM2 HA-WT-PKM2 L858R-EGFR EGFR Tetramer ► IB: HA HA Dimer ► Monomer ► k l Input IP: HA Input IP: HA F-1,6-BP F-1,6-BP HA-R399E-PKM2 HA-K305Q-PKM2 HA-WT-PKM2 Ex19del-EGFR Ex19del-EGFR EGFR EGFR HA HA m F-1,6-BP hr CHX EGFR 1 0.9 0.8 0.75 1 0.5 0.4 0.2 PKM2 GAPDH
Supplementary Figure S4 Dimeric PKM2 interacts with and stabilizes EGFR. (a) Lysates of H1975 and H157 cells were prepared for immunoprecipitation with anti-PKM2 antibody followed by immunoblotting with anti-EGFR and anti-PKM2. (b)Immunofluorescence for EGFR, PKM2, and 4, 6-diamidino-2-phenylindole (DAPI) in H1975. Scale bar: 20 µm. (c) Immunoprecipitation of EGFR with anti-HA in 293T cells co-transfected with HA-PKM2 or HA-K367M-PKM2 and EGFR. (d) Immunoprecipitation of EGFR with anti-HA in 293T cells co-transfected with HA-PKM2 or HA-PKM1 and EGFR. (e) Immunoprecipitation of EGFR with anti-Flag beads in 293T cells co-transfected with Flag-tagged PKM2 and EGFR. Before co-transfection, the endogenous PKM2 were depletion by sh-PKM2 targeting the 3’-UTR region. (f) Immunoprecipitation of PKM2 or myc-EGFR fragments with anti-myc/HA in 293T cells co-transfected with HA-PKM2 and myc-ECM or myc-ICM. ECM: extracellular domain; ICM: intracellular domain. (g) Immunoprecipitation of myc-EGFR fragments with anti-HA in 293T cells co-transfected with HA-PKM2 and myc-ICM-KA or myc-ICM-AP. KA: kinase activity domain; AP: autophosphorylation domain. (h) Native gel electrophoresis performed to separate PKM2 protein complexes in 293T cells transfected with wild type PKM2, followed by Western blotting with PKM2 antibody. Cells were treated with 200 µM F-1,6-BP for 2 hour before collecting cell lysates. (i) Immunoprecipitation of L858R EGFR with anti-HA in 293T cells co-transfected with HA-PKM2 and mutant EGFR. Cells were treated with 200 µM F-1,6-BP for 2 hour before collecting cell lysates. (j) Native gel electrophoresis performed to separate PKM2 protein complexes in 293T cells transfected with HA-wild-type, R399E-, K305Q-PKM2, followed by Western blotting with HA antibody. (k) Immunoprecipitation of EGFR with anti-HA in 293T cells co-transfected with HA-PKM2 or HA-R399E PKM2 and mutant EGFR. (l) Immunoprecipitation of EGFR with anti-HA in 293T cells co-transfected with HA-K305Q PKM2 and mutant EGFR, with/without F-1,6-BP treatment. (m) PC9 cells were treated with cycloheximide to compare the degradation of mutant EGFR in absence and presence of F-1,6-BP. 10µM cycloheximide was added and degradation was measured at indicated intervals from hours 0 to 12. Protein expression levels were normalized with an internal control and quantified as a ratio compared with hour 0.
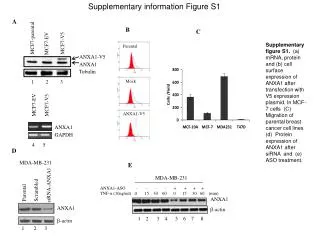
Supplemental Figure S5 a b IP: L858R-EGFR PKM2 PKM2 Input IgG PKM2 HSP90α HSP90β PKM2 sh-HSP90α His-HSP90β EGFR His-PKM2 ◄ His-HSP90 1 2 0.8 100 IB: HSP90 HSP90 75 PKM2 IB: PKM2 ◄ His-PKM2 63 GAPDH c d PC9 H1975 IP: Input 17-AAG IgG PKM2 EGFR EGFR HSP90 HSP90 PKM2 PKM2 GAPDH e sh-PKM2-1 sh-PKM2-2 sh-control MET HER2 EGFR PKM2 GAPDH
Supplementary Figure S5 PKM2 interacts with HSP90 and stabilizes EGFR by direct interaction. (a)Purified His-HSP90β and His-PKM2 were mixed overnight at 4℃. PKM2 levels were pulled down using anti-PKM2 antibody conjugated with agarose A beads and then tested by Western blotting with anti-PKM2 and anti-HSP90 (Left). Rabbit IgG used as negative control. Coomassie blue staining served as the loading control for HSP90α, HSP90β, and PKM2. (b) Transient ectopic expression of mutant EGFR in lysates from 293T cells with or without wild type PKM2. Cells were treated with sh-HSP90 to inhibit HSP90 expression. (c) EGFR were detected by Western blotting with 100nM 17-AAG treatment for 16 hours to inhibit HSP90 activity in PC9 and H1975 cells. (d) Lysates of H157 cells were prepared for immunoprecipitation with anti-PKM2 antibody followed by immunoblotting with anti-EGFR, anti-HSP90 and anti-PKM2.. (e) Depletion of PKM2 did not change MET, Her2, another HSP90 client, protein levels in H1975 cells.
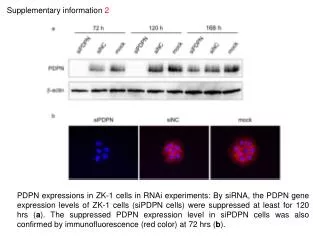
Supplemental Figure S6 72hr 48hr a sh-control sh-PKM2 sh-PKM2 sh-EGFR sh-EGFR PC9 H1975 H157 PC9 H1975 apoptosis cells (%) sh-control sh-control sh-PKM2-48h sh-EGFR-48h sh-EGFR-72h sh-PKM2-72h sh-PKM2-48h sh-EGFR-48h sh-PKM2-72h sh-EGFR-72h H157 apoptosis cells (%) sh-control sh-PKM2-48h sh-PKM2-72h sh-EGFR-48h sh-EGFR-72h
Supplementary Figure S6 Knockdown of PKM2 or EGFR induced cell apoptosis in EGFR mutant cells. (a) Apoptosis status of PC9, H1975, and H157 cells after knockdown of PKM2 or EGFR were measured by annexin V staining and flow cytometry after PKM2 or EGFR depletion for indicated times (upper). The quantification of results obtained in apoptosis analysis (lower).
Supplemental Figure S7 a b EGFR mutant patients EGFR wild type patients P = 0.0084 P = 0.0005 100 100 80 80 N = 74 N = 38 60 60 Survival probability (%) Survival probability (%) 40 N = 61 N = 53 40 20 20 0 0 0 40 80 120 0 40 80 120 Time (Months) Time (Months) PKM2 High PKM2 High PKM2 Low PKM2 Low Supplementary Figure S7 PKM2 levels were correlated with lung cancer patients. (a and b)Kaplan-Meier disease free survival rate analysis of (a) 127 patients with mutated EGFR, and (b) 99 patients with wild type EGFR, stratified by PKM2 mRNA levels. The PKM2 mRNA levels were determined by Affymetrix U133 Plus 2.0 microarray analysis (probe set: 201251_at). The patients were classified as high or low PKM2 by a cut-off value equal to the median score of all patients. The clinical data were obtained from the GEO data base: GSE31210.