Download

1 / 27
270 likes | 408 Vues
This study evaluates the effects of β-glucoside metabolism on the viability and behavior of Dictyostelium discoideum and various Caenorhabditis nematodes. The findings highlight the role of different β-glucosides, such as arbutin and salicin, on the growth and survival of these organisms. Experimental results include plaque assays, viability tests, and behavioral assays, providing insights into the lethal effects of metabolites derived from bacterial interactions on these model organisms. Additional data on bacterial strains and their impact on soil samples further enrich the study.

E N D
a b Fig S1:Effect of β-glucoside metabolism on Dictyostelium discoideum a) Duplicate plot of NC4 viability experiment shown in Figure 1. b) Viability of amoebae plotted as number of Ax2 plaques formed on SM + bacterial lawn at different time points of incubation in SM/5 medium containing55mM glucose and 50a (Bgl+) [50a + Glucose], 36mM arbutin and 50a (Bgl+) [50a + Arbutin], 36mM arbutin [Arbutin]. “Not detected (ND) “ indicates the absence of plaque formation at subsequent time points when similar dilution in other conditions showed detectable plaque formation
Table S2 Dictyostelium discoideum Ax2 plaque assay (+) indicates plaque formation or presence of viable amoeba and (-) indicates no plaques or absence viable amoeba. n=3 * Bgl+ supernatant was obtained by growing Bgl+ bacteria in 36 mM salicin for 36hrs followed by concentrating the supernatant to solid form.
Table S3 : Effect of utilization of multiple β-glucosides on the viability of Ax2 ASE= Arbutin Salicin Esculin, SM# = SM without glucose n=3
Table S4. Lethal effect of salicin metabolism on C elegans Eggs were exposed to the test environment (NGM + salicin + Bgl+ bacteria). L2*= L2 of the second generation. Bacteria were grown overnight at 37oC as spots in different test environments prior to the addition of N2 eggs. Subsequent incubations after addition of eggs were at 160C. n=3
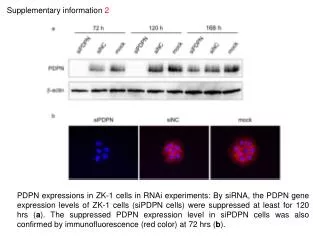
Fig S2:Effect of addition of concentrated culture supernatant of Bgl+ bacteria grown on salicin on N2 nematodes Bgl+ bacteria were grown on 35 mM salicin for 36hrs and the culture supernatant was concentrated to solid form. The concentrated supernatant was added to NMG agar at a final concentration of 0.4%. Young adult N2 worms were transferred to the plate seeded with OP50 and their survival was plotted over several days. The control plates had N2 worms on NGM + OP50 without the supernatant. n=3
Figure S3.Detection of saligenin (aglycone part of salicin) Thin Layer Chromatogram of supernatants of bacteria grown in the presence salicin. Organic extracts of Bgl+ (lane 2-4) and Bgl- (lane 5) culture supernatants were fractionated by TLC. Their migration rates were compared with that of pure saligenin (lane 1) indicated by the arrow.
Fig. S 4a. 1H NMR spectra of crystals obtained from supernatants of bacteria grown in the presence of salicin. 1H NMR (400 MHz, CDCl3): δ 7.30 (s, 1H), 7.22-7.19 (t, J = 8 Hz, 1H), 7.04-7.02 (d, J= 8 Hz, 1H), 6.89-6.87 (d, J= 8 Hz, 1H), 6.87-6.83 (t, J= 8 Hz, 1H), 4.86 ( s, 2H), 2.35 (s, 1H)
Fig. S4b. 13C NMR spectra of crystals obtained from supernatants of bacteria grown in the presence of salicin. 13C NMR (400 MHz, CDCl3): δ 156.05, 129.51,127.81, 124.61, 120.07, 116.53, 64.64.
Figure S5a.Effect of arbutin metabolism and saligenin on worm behavior Chemotaxis assay was performed as described in Materials and Methods. 50-Arbutin and 32mM Saligenin were the test conditions.
Figure S5b.Effect of salicin metabolism on worm behavior Lawn avoidance assay of N2 (See Supplementary Methods for details). n=5. (Error bars indicate SD)
N2 + 40 mM Saligenin dop-1 + 40 mM Saligenin Figure S5c.Effect of salicin metabolism on worm behavior Anesthetic assay of wild type N2 and the dop-1 mutant. One day adult worms were suspended in 40mM saligenin and their spontaneous thrashing movement was monitored after 20 minutes. Motile worms here means worms with spontaneous thrashing movement. Approximately 20 worms were used for each experiment. N=5
Table S5: Frequency of occurrence of cellular slime moulds, nematodes and Enterobacteriaceae (Sal+/Sal-) in soil samples. +, - and NA represents presence, absence and not analyzed respectively in the case of amoeba.
Fig S6: Distribution of bacteria and their predators extrapolated from Table S5. Total soil samples considered=31 Bgl- 8 17 6 Amoeba Nematode Bgl+ Bgl+ 3 17 11 Nematode Bgl- 6 5 Nematode Amoeba Amoeba
Table S6: Soil nematodes isolated in this study* * Typed by using 18S rDNA sequencing (36)
Figure S7. Viability assay of Mesorhabditis sp with different concentrations of saligenin Survival of soil nematodes (plotted as percentage live worms versus time) was monitored on NGM plates containing different concentrations of saligenin and OP50. ~20 adult nematodes were used in each experiment. n=3
Figure S8. Effect of saligenin on the viability of different wild Caenorhabditis strains Survival of different Caenorhabditis species, plotted as percentage live worms versus time, was monitored on NGM plates containing 28mM saligenin and OP50. ~20 adult worms were used in each experiment. n=3
Fig S9: Determination of minimum concentration of saligenin sensed and avoided by Mesorhabditis sp. Avoidance assay was performed as described before except multiple concentrations of saligenin were used here. ~ 20 adults were used for each experiment. n=5, Error bars indicate SD.
Fig S10: Avoidance assay performed with hydroquinone and salicin Avoidance assay was performed as described before. Members of both Oscheius and Mesorhabditis were considered for the assay. ~ 20 adults were used for each experiment. The plot is representative of independent experiments performed either with Oscheius or Mesorhabditis strains showing similar trend. n=5, Error bars indicate SD.
Fig S11: Chemotaxis assay performed with wild isolates of Caenorhabditis Assay was performed as described before. N2 was used as control. n=5, Error bars indicate SD.
Fig S12: Effect of salicin metabolism on nematodes in soil environment The soil microcosm experiment was performed as described in Materials and Methods ~ 108 cellsof either AK102 (Bg+) or AK1 (Bgl-) bacteria were added in soil along with ~ 100 nematodes. Number of adult nematodes extracted after 10 days were plotted. n=3. Error bars here represent SD
b a Figure S13a,b.Growth of Shigella sonnei strain AK102 (Bgl+) on saligenin-killed amoebae (Ax2) and nematodes (N2). Growth of AK102 in KK2 buffer supplemented with dead predators N2 (AK102 + N2), Ax2 (AK102 + Ax2) or without predators (AK102 + Buffer) was monitored and plotted as log CFU versus time. Both N2 and Ax2 were killed by incubating them with 32mM saligenin for 48hrs. The plots are representative of three independent experiments showing a similar trend
** Fig S14: Activity of the bgl promoter in the presence of Ax2 cells or Ax2 culture supernatant. The strains BGL1H (Bgl+) and JM-chb1 (Bgl-) harboring bgl-lacZ and chb-lacZ transcriptional fusions respectively were cultured in the presence or absence of Ax2 cells or Ax2-culture supernatant. Beta-galactosidase activity in the two strains was measured after 6 hrs as described by Miller (37). n = 4. Error bar indicates SD. ** indicates p≤ .01 by Student’s t-test.
Supplementary references 33) Madan R, Moorthy S, Mahadevan S. 2008 Enhanced expression of the bgl operon of Escherichia coli in the stationary phase. FEMS Microbiol Lett 288: 131–139 34) Plumbridge, J. & Pellegrini O 2004 Expression of the chitobiose operon of Escherichia coli is regulated by three transcription factors: NagC, ChbR and CAP. Mol Microbiol52: 437-449 35) Kachroo, A. H., A. K. Kancherla, N. S. Singh, U. Varshney & S. Mahadevan, 2007 Mutations that alter the regulation of the chb operon of Escherichia coli allow utilization of cellobiose. Mol Microbiol66: 1382-1395. 36) Haber, M., Schungel, M., Putz, A., Muller, S., Hasert, B., and Schulenburg, H. 2005. Evolutionary history of Caenorhabditis elegans inferred from microsatellites: Evidence for spatial and temporal genetic differentiation and the occurrence of outbreeding. Mol. Biol. Evol. 22, 160-173 37) Miller JH 1992 A short course in bacterial genetics. A laboratory manual and handbook for Escherichia coli and related bacteria. Cold Spring Harbor Laboratory Press, Cold Spring Harbor,NY, USA.