Download
1 / 3
30 likes | 159 Vues
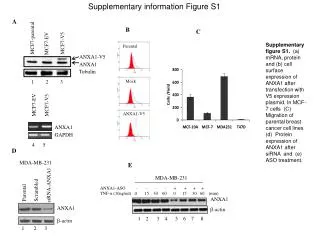
Supplementary information Figure S1. MDA-MB-231. ANXA1-ASO - - - - + + + + TNF- α (10ng/ml) 0 15 30 60 0 15 30 60 (min). ANXA1. -actin. 1 2 3 4 5 6 7 8. MDA-MB-231.

E N D
Supplementary information Figure S1 MDA-MB-231 ANXA1-ASO - - - - + + + + TNF-α (10ng/ml) 0 15 30 60 0 15 30 60 (min) ANXA1 -actin 1 2 3 4 5 6 7 8 MDA-MB-231 siRNA-ANXA1 Parental Scrambled ANXA1 -actin 1 2 3 A MCF7-V5 MCF7-EV B C ANXA1 Supplementary figure S1. (a) mRNA, protein and (b) cell surface expression of ANXA1 after transfection with V5 expression plasmid. In MCF-7 cells (C) Migration of parental breast cancer cell lines (d) Protein expression of ANXA1 after siRNA and (e) ASO treatment. GAPDH Parental Mock ANXA1-V5 4 5 MCF7-parental MCF7-EV MCF7-V5 ANXA1-V5 ANXA1 Tubulin 1 2 3 D E
Supplementary information Figure S2 1 5 6 7 8 9 10 1112 Fraction p100 MDA-231 p52 p100 MCF7-V5 p52 1 5 6 7 8 9 10 11 12 Fraction p100 MCF7-EV 75 p52 MDA-231 TAK1 48 1 5 6 7 8 9 10 11 12 Fraction IKKβ MDA-231 75 MCF7-V5 TAK1 48 IKKβ MCF7-V5 75 MCF7-EV TAK1 48 IKKβ MCF7-V5 MCF7-EV CXCL12 (100ng/ml) 0 15 30 60 - (min) p65:p50 CXCL12 (100ng/ml) 0 15 30 60 - (min) TNF (10ng/ml) - - - - 30 (min) ANXA1- ASO + + + + + p65:p50 1 2 3 4 5 A B Supplementary figure S2. (A-D) Analysis of gel filtration chromatography analysis of IKK, TRADD, TAK1 and p100/p52. (E) EMSA blots for NF-kB activity. C D E
Supplementary information Figure S3 Supplementary figure S3 (A) Nu/nu athymic mice were injected s.c with MCF7 cells (empty vector) or ANXA1 overexpression vector and monitored over 40 days. Tumor volume was calculated as (length x width x width)/2. (B) MMTV-PyMT mice were crossed to ANXA1 -/- to obtain PyMT ANXA1 +/- and -/- mice. No significant difference was observed in the % of mice with palpable tumors as well as tumor onset. PyMT ANXA1 +/- PyMT ANXA1 -/-