Synergistic Effect of BA and Doxorubicin on Apoptosis Induction in Cancer Cells
170 likes | 267 Vues
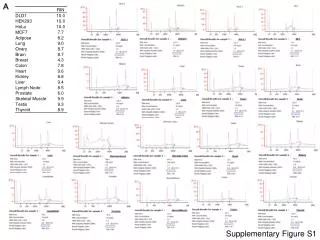
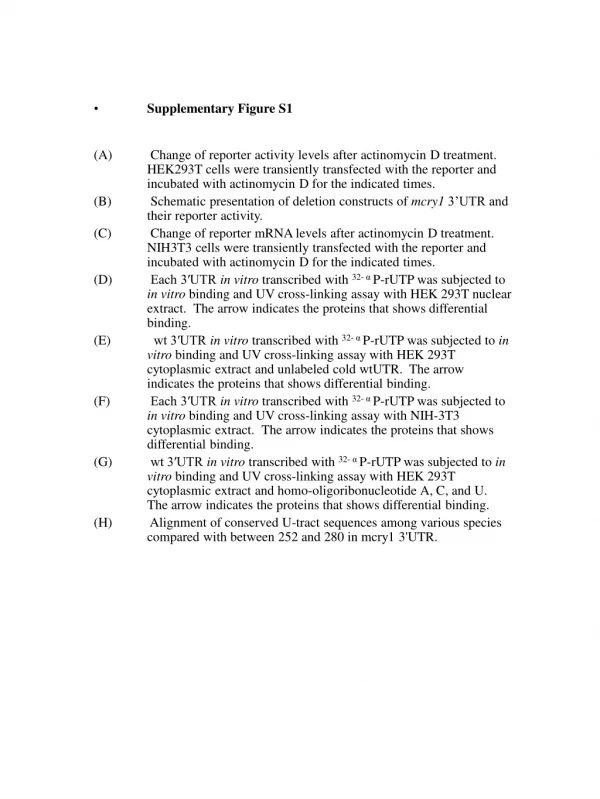
This study investigates the combined application of Betulinic Acid (BA) and Doxorubicin (doxo) on the induction of apoptosis in cancer cells. The results show a significant increase in specific apoptosis percentage with the simultaneous use of BA and doxo compared to their individual effects. Supplementary figures provide detailed data analysis on various aspects of apoptosis, molecular mechanisms involved, and the impact of gene silencing on cell response. Statistical comparisons are presented to support the findings.

Synergistic Effect of BA and Doxorubicin on Apoptosis Induction in Cancer Cells
E N D
Presentation Transcript
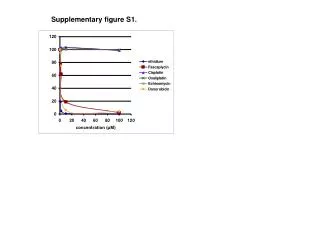
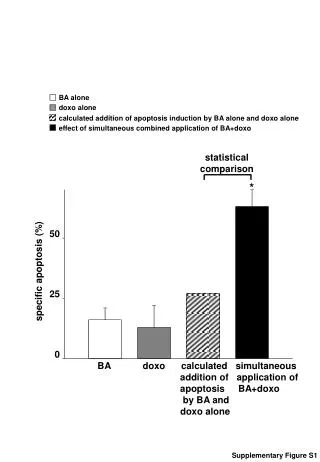
BA alone doxo alone calculated addition of apoptosis induction by BA alone and doxo alone effect of simultaneous combined application of BA+doxo statistical comparison * 50 25 0 specific apoptosis (%) BA doxo calculated simultaneous addition of application of apoptosis BA+doxo by BA and doxo alone Supplementary Figure S1
50 25 0 BA doxo BA+doxo * specific apoptosis (%) JURKAT doxoR Supplementary Figure S2
A B 100 75 50 25 0 parental shNOXA specific apoptosis (%) 0 2 6 12 20 BA (µM) 100 75 50 25 0 parental shNOXA specific apoptosis (%) 0 0,01 0,03 0,1 doxo (µM) Supplementary Figure S3
- - - - - - - - + + + + + + + + - - - - - - - - + + + + + + + + C D 24h 36h BA doxo cIAP-2 XIAP Survivin GAPDH 24h 36h BA doxo BIM BID BAK BCL-2 BCL-XL GAPDH Supplementary Figure S3
E F 100 75 50 25 0 parental shMcl-1 specific apoptosis (%) 0 2 6 12 20 BA (µM) 100 75 50 25 0 parental shMcl-1 specific apoptosis (%) 0 0,01 0,03 0,1 doxo (µM) Supplementary Figure S3
100 75 50 25 0 parental shp53 specific apoptosis (%) 0 2 6 12 20 BA (µM) 100 75 50 25 0 parental shp53 specific apoptosis (%) 0 0,01 0,03 0,1 doxo (µM) A B Supplementary Figure S4
BA doxo BA+doxo 50 25 0 * * NS specific apoptosis (%) parental mock shp53 p53 GAPDH Supplementary Figure S5
A B VP16 co 12h 24h 36h 48h irradiation co 12h 24h 36h 48h p53 p53 PUMA PUMA GAPDH GAPDH VP16 co 12h 24h 48h irradiation co 12h 24h 48h p53 p53 PUMA PUMA GAPDH GAPDH Supplementary Figure S6
sicontrol sip53 siNOXA 75 50 25 0 C D sicontrol sip53 siNOXA specific apoptosis (%) 0 0,6 2 6 BA (µM) 75 50 25 0 specific apoptosis (%) 0 0,05 0,2 0,5 doxo (µM) Supplementary Figure S6
sicontrol sip53 siNOXA sicontrol sip53 siNOXA E F 100 75 50 25 0 specific apoptosis (%) 0 0,2 0,6 2 6 BA (µM) 100 75 50 25 0 specific apoptosis (%) 0 0,01 0,03 0,1 doxo (µM) Supplementary Figure S6
75 50 25 0 BA doxo BA+doxo - - - - - - - - - - - - + + + + + + + + + + + + - - - - - - - - - - - - + + + + + + + + + + + + G * * NS NS specific apoptosis (%) sicontrol sip53 siNOXA siPUMA sicontrol sip53 BA doxo p53 Histon H1 sicontrol siNOXA BA doxo NOXA GAPDH sicontrol siPUMA BA doxo PUMA GAPDH Supplementary Figure S6
H 1,0 0,75 0,5 0,25 0 doxo 0 0,25 0,5 0,75 1,0 BA 1,0 0,75 0,5 0,25 0 doxo 0 0,25 0,5 0,75 1,0 BA Supplementary Figure S6
1,0 0,75 0,5 0,25 0 H doxo 0 0,25 0,5 0,75 1,0 BA Supplementary Figure S6
A B 100 75 50 25 0 parental shNOXA specific apoptosis (%) 0 0,1 0,3 1 VCR (nM) 100 75 50 25 0 parental shp53 specific apoptosis (%) 0 0,1 0,3 1 VCR (nM) Supplementary Figure S7
BA VCR BA+VCR C 75 50 25 0 * * NS NS specific apoptosis (%) parental shp53 shNOXA shPUMA Supplementary Figure S7
parental shp53 shNOXA parental shp53 shNOXA A B 100 75 50 25 0 specific apoptosis (%) 0 2 6 20 BA (µM) 100 75 50 25 0 specific apoptosis (%) 0 0,05 0,2 0,5 doxo (µM) Supplementary Figure S8
BA doxo BA+doxo C 75 50 25 0 * * NS specific apoptosis (%) NS parental shp53 shNOXA shPUMA Supplementary Figure S8