Analysis of Compound Effects on NADH Inhibition and LDHA Concentration in Various Cancer Cell Lines
This study investigates the concentration of different compounds (Cmpd 1, Cmpd 2, Cmpd 3) on NADH inhibition and LDHA levels across multiple cancer cell lines, including HEK293, SNU398, HepG2, and others. Using LC-MS/MS techniques and SILAC labeling, we determined the IC50 values of the compounds and their impact on LDHA expression. The data reveals varying concentrations of LDHA per cell across the cancer types and highlights the effects of metabolic pathways involved, such as glycolysis and fatty acid synthesis.

Analysis of Compound Effects on NADH Inhibition and LDHA Concentration in Various Cancer Cell Lines
E N D
Presentation Transcript
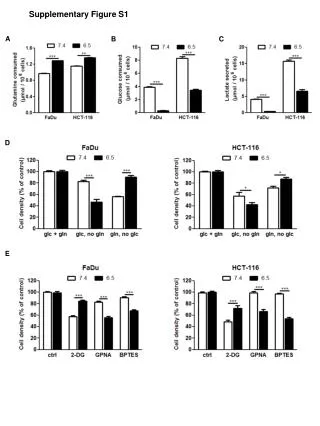
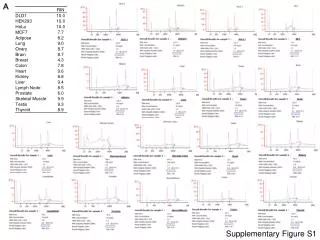
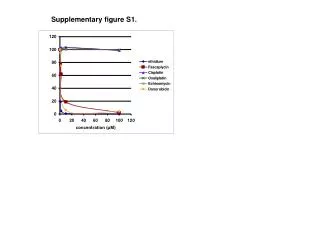
A concentration in cell, mM Cmpd 1 Cmpd 2 Cmpd 3 B NADH Cmpd IC50 120 mM 67 nM 100 60 mM 43 nM 30 mM 22 nM 75 5 mM 12 nM % inhibition 50 25 -9 -8 -7 -6 -5 Compound 2 Supplementary Figure S2
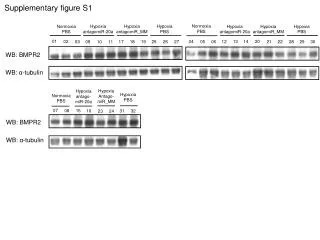
A 13C 12C 13C 15N- 15N- 14N- Arg/Lys Arg/Lys Arg/Lys SILAC LLIVSNPVDILTYVAWK HEK293 SNU398 Trypsin digest Trypsin digest Spike LC-MS/MS LC-MS/MS 100 100 recomb LDHA Protein Concentration B SILAC % Relative Intensity % Relative Intensity HEK293 Prepare lysates Protein Concentration Mix 1:1 Ratio triplicate 0 0 973 975 977 973 975 977 Snu398 HEK293 rLDHA HEK293 C LDHA cell concentration LDHA copies/cell mM Hek293 5.4 3.8 x 10⁶ Snu398 2.9 x 10⁶ 1.5 HepG2 4.7 x 10⁶ 2.6 Supplementary Figure S3
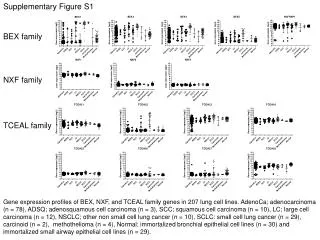
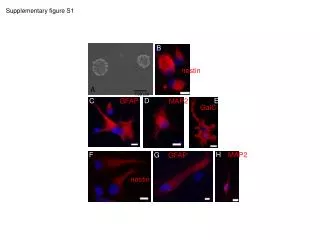
A B A2780 MDA-MB-453 Snu423 NCI-H1395 Cal-27 MiaPaCa-2 HepG2 786-O Snu398 U251 HepG2 Kidney Melanoma Liver Colon Pancreas Breast LDHA LDHA LDHB LDHB b-actin b-actin C D LDHA, mM LDHA, mM E trxn 1, days trxn 2, days 2 3 4 7=0 2 4 7 WB LDHA + + + + + + + LDHAsi Supplementary Figure S4
A FBP, nmol/mln cells DMSO Cmpd 1 Cmpd 2 B FBP, nmol/mln cells < 0.3 DMSO Cmpd 1 Cmpd 2 Supplementary Figure S6
A Snu398 HepG2 relative pathway activity pentose phosphate glycolysis fatty acid synthesis glutaminolysis B Supplementary Figure S8