Download
1 / 1
10 likes | 113 Vues
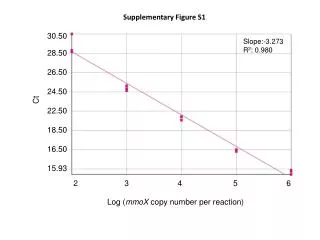
This supplementary figure depicts the logarithmic relationship between mmoX copy number per reaction and Ct values, showing a linear regression with a slope of -3.273 and a high R2 value of 0.980. The graph provides crucial insights into the quantitative analysis of the target gene expression.

E N D
Supplementary Figure S1 30.50 28.50 26.50 24.50 22.50 18.50 16.50 15.93 Slope:-3.273 R2: 0.980 Ct 2 3 4 5 6 Log (mmoX copy number per reaction)