1H-15N HSQC Spectra Analysis of 15N-labeled ZG16p with Various Ligands
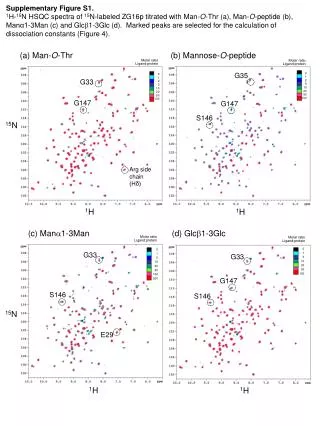
This study presents 1H-15N HSQC spectra of 15N-labeled ZG16p titrated with different ligands: Man-O-Thr, Man-O-peptide, Manα1-3Man, and Glcβ1-3Glc. The marked peaks in the spectra facilitate the calculation of dissociation constants, as detailed in Figure 4. The molar ratios of the ligands to the protein are systematically varied to assess binding interaction dynamics. Supplementary Figure S2 includes Fo-Fc electron density maps for each ligand complex with ZG16p, highlighting the observed electron density at various levels.


1H-15N HSQC Spectra Analysis of 15N-labeled ZG16p with Various Ligands
E N D
Presentation Transcript
Supplementary Figure S1. 1H-15N HSQC spectra of 15N-labeled ZG16p titrated with Man-O-Thr (a), Man-O-peptide (b), Manα1-3Man (c) and Glc1-3Glc (d). Marked peaks are selected for the calculation of dissociation constants (Figure 4). (a) Man-O-Thr (b) Mannose-O-peptide Molar ratio Ligand:protein Molar ratio Ligand:protein G35 0 1 2 5 10 20 50 100 0 1 2 5 10 20 50 100 G33 G147 G147 S146 15N Arg side chain (Hδ) 1H 1H (c) Mana1-3Man (d) Glcb1-3Glc Molar ratio Ligand:protein Molar ratio Ligand:protein 0 1 5 10 20 50 100 0 1 5 10 20 50 100 200 G33 G33 G147 S146 S146 15N E29 1H 1H
Supplementary Figure S2. The observed electron density of each ligand. Fo-Fc electron density maps of each ligand are shown in gray mesh, countered at 1s level ((a), (c) and (d)) or 0.5s level (b). (a) Man-O-Ser/ZG16p, (b) Man-O-Thr/ZG16p, (c) Manα1-3Man/ZG16p and (d) Glc1-3Glc/ZG16p. (b) Man-O-Thr (a) Man-O-Ser Tyr104 Tyr104 Ser 148 Ser 148 Asp 151 Asp 151 (d) Glcb1-3Glc (c) Mana1-3Man Tyr104 Ser 148 Tyr104 Ser 148 Asp 151 Asp 151