Download
1 / 30
300 likes | 360 Vues
Explore gene expression patterns in CAR wildtype and knockout mice liver tissues using Principal Component Analysis (PCA) to identify similarities and differences in gene expression. The PCA method reveals variance in gene expression data sets, showcasing overall gene expression profiles.

E N D
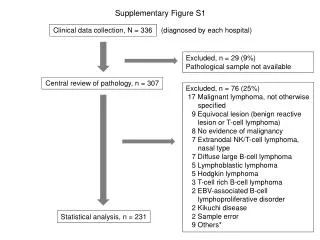
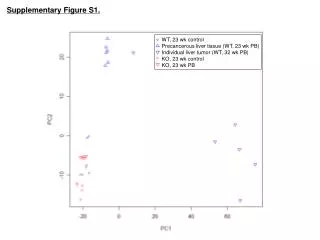
Supplementary Figure S1. WT, 23 wk control Precancerous liver tissue (WT, 23 wk PB) Individual liver tumor (WT, 32 wk PB) KO, 23 wk control KO, 23 wk PB
Legend - Supplementary Figure S1. Principle Component Analysis (PCA) of gene expression patterns exhibited in tissue samples from constitutive active/androstane receptor (CAR) wildtype (WT) and knockout (KO) mice. Microarray analysis was performed on RNA isolated from 5 groups of tissues which were obtained from livers of control and phenobarbital (PB)-treated mice: WT, 23 wk control, N=5; precancerous liver tissue (WT, 23 wk PB), N=6; individual liver tumors (WT, 32 wk PB), N=6; KO, 23 wk control, N=5; and KO, 23 wk PB, N=5. PCA is a dimension reduction technique that creates axes through the data (Principal Components; PC) that account for variability within the data set. PC1 accounts for the largest variance, PC2 is orthogonal to PC1 and accounts for the next largest variance, and so forth, until all of the variance is explained. Similarities and differences of overall gene expression patterns are evident.
WT, 23 wk controlPrecancerous liver tissue (WT, 23 wk PB)Individual liver tumors (WT, 32 wk PB)KO, 23 wk control KO, 23 wk PB Supplementary Figure S2. 11 1 22 2 1132342 3 3 435 4 544 5 65 5 6
Legend - Supplementary Figure S2. Distribution of microarray data that were generated using RNA isolated from constitutive active/androstane receptor (CAR) wildtype (WT) and knockout (KO) mouse tissues. Microarray analysis was performed on RNA isolated from 5 groups of tissues which were obtained from livers of control and phenobarbital (PB)-treated mice: WT, 23 wk control, N=5; precancerous liver tissue (WT, 23 wk PB),N=6; individual liver tumors (WT, 32 wk PB),N=6; KO, 23 wk control,N=5; and KO, 23 wk PB, N=5. A “box-and-whisker” plot was utilized to express the distribution of the data. The individual samples are listed along the bottom of the figure, and the normalized intensity values (in log2 form), representing expression levels, are listed along the left-hand side. The white bars represent the interquartile range (IQR), which extends from the 25th to the 75th percentiles, and the horizontal black bars within the IQR represent the median value. The “whiskers” end at + 1.5 * IQR units. Every dot (o) beyond the “whiskers” reflects an outlying data point.
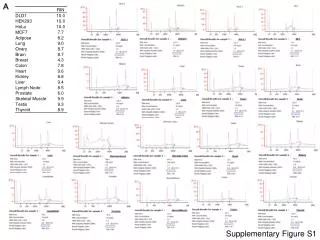
Precancerous (113) Tumor (889) Supplementary Figure S3. Genes active in precancerous liver tissue and/or individual liver tumors in at least 3/6 total mice/group: 933 44↑ 28 ↓ 16 820↑ 528 ↓ 292 69↑ 60 ↓ 9 Precancerous (51) Tumor (385) Genes active in precancerous liver tissue and/or individual liver tumors in at least 5/6 total mice/group: 402 17↑ 14 ↓ 3 351 ↑ 243 ↓ 108 34↑ 30 ↓ 4 Precancerous (35) Tumor (94) Genes active in precancerous liver tissue and/or individual liver tumors in all 6 mice/group: 106 12↑ 10 ↓ 2 71↑ 59 ↓ 12 23↑ 22 ↓ 1
Legend - Supplementary Figure S3. Identification of uniquely active genes in precancerous liver and/or individual liver tumors. Microarray analysis was employed to identify uniquely active genes in precancerous liver tissue and/or individual liver tumors, as described in the Methods, based on at least 3/6 samples exhibiting expression levels outside of the 99% confidence interval (CI) of the normalized intensity values of the control group, in addition to being > 2-fold up- or down-regulated. Comparison of 113 uniquely active genes in precancerous liver tissue (Supplementary Table S3B) and 889 uniquely active genes in individual liver tumors (Supplementary Table S3E) revealed a total of 933: 69 carried forward (i.e. were uniquely induced or repressed in both groups), while 44 were altered uniquely in precancerous liver tissue and 820 were altered uniquely in individual liver tumors (Fig. 1; Supplementary Tables S3G-I). In order to be progressively more stringent, core groups of uniquely active genes were identified based on at least 5/6 and 6/6 samples exhibiting expression levels outside of the 99% CI of the normalized intensity values of the control group data, in addition to being > 2-fold up- or down-regulated. Comparison of 51 genes that were uniquely active in at least 5/6 precancerous liver samples (Supplementary Table S4A) and 385 genes that were uniquely active in at least 5/6 individual liver tumors (Supplementary Table S4B) revealed a total of 402: 34 genes carried forward, while 17 genes were altered uniquely in precancerous liver tissue and 351 genes were altered uniquely in individual liver tumors (Supplementary Tables S4C-E). Finally, comparison of 35 genes that were uniquely active in all 6 precancerous liver samples (Supplementary Table S4F) and 94 genes that were uniquely active in at all 6 individual liver tumors (Supplementary Table S4G) revealed a total of 106: 23 genes carried forward, while 12 genes were altered uniquely in precancerous liver tissue and 71 genes were altered uniquely in individual liver tumors (Supplementary Tables S4H-J).
P,T P,T Supplementary Figure S4. T T T T P*,T* T T T T* T T « T « T** T P*,T* T T P**,T* T* T T T* P,T T T* T* T P**,T** T ↑P, ↓T T T T T T T P,T T T T
Legend – Supplementary Figure S4. The expression and/or methylation statuses of genes involved in the cell cycle were altered in precancerous and tumor tissue. Microarray analysis was employed to identify uniquely active genes in precancerous liver tissue (P) and/or individual liver tumors (T), as described in the Methods. Functional annotation of 933 uniquely active genes (Fig. 1; Supplementary Tables S3G-I) was performed. Genes in blue font were active in at least 5/6 individual liver tumors. Expression was up-regulated (red symbols), down-regulated (green symbols), or changed in opposite directions in precancerous liver tissue and individual liver tumors (orange symbols; ↑ and ↓). The tissue (P or T) is underlined one time if the expression change was confirmed by quantitative real-time PCR (qRT-PCR) and two times if qRT-PCR revealed a unique expression change which was not detected by microarray analysis. Genes not selected for confirmation by qRT-PCR lack underlining and asterisks. If a gene, identified from a unique PB-induced region of altered DNA methylation (RAM) in precancerous liver tissue and/or individual liver tumors (Phillips and Goodman, 2009), exhibited a unique expression change based on qRT-PCR, this is denoted by a red symbol and an asterisk (*), while an indication of a unique expression change is represented by a red symbol and 2 asterisks (**). If there was no indication of an expression change, the gene is depicted by a gray symbol and an asterisk (*). Positive ( ) or negative ( ) regulation is illustrated, and shapes of the entities represent the specific class of molecules to which the gene belongs: extracellular proteins ( ), ligands ( ), kinases ( ), transcription factors ( ), and phosphatases ( ). p21 and p18 («) are represented by their official gene symbols (Cdkn1a and Cdkn1c, respectively) in Supplementary Tables S2A-C and S3A-I.
P,T Supplementary Figure S5. T T T T T* P*,T* T T « T T* P**,T* T T P**,T** P,T T T ↑P, ↓T T T T T P,T T T
Legend – Supplementary Figure S5. The expression and/or methylation statuses of genes involved in apoptosis were altered in precancerous and tumor tissue. Microarray analysis was employed to identify uniquely active genes in precancerous liver tissue (P) and/or individual liver tumors (T), as described in the Methods. Functional annotation of 933 uniquely active genes (Fig. 1; Supplementary Tables S3G-I) was performed. Genes in blue font were active in at least 5/6 individual liver tumors. Expression was up-regulated (red symbols), down-regulated (green symbols), or changed in opposite directions in precancerous liver tissue and individual liver tumors (orange symbols; ↑ and ↓). Akt1 (white symbol), while not altered in response to PB, is included because it ‘links’ Efnb2 to apoptosis. The tissue (P or T) is underlined one time if the expression change was confirmed by quantitative real-time PCR (qRT-PCR) or two times if qRT-PCR revealed a unique expression change which was not detected by microarray analysis. Genes not selected for confirmation by qRT-PCR lack underlining and asterisks. If a gene, identified from a unique PB-induced region of altered DNA methylation (RAM) in precancerous liver tissue and/or individual liver tumors (Phillips and Goodman, 2009), exhibited a unique expression change based on qRT-PCR, this is denoted by a red symbol and an asterisk (*), while an indication of a unique expression change is represented by a red symbol and 2 asterisks (**). If there was no indication of an expression change, the gene is depicted by a gray symbol and an asterisk. Positive ( ) or negative ( ) regulation is illustrated, and the shapes of the entities represent the specific class of molecules to which the gene belongs: extracellular proteins ( ), ligands ( ), kinases ( ), transcription factors ( ), and phosphatases ( ). p21 («) is represented by its official gene symbol (Cdkn1a) in Supplementary Tables S2A-C and S3A-I.
P,T P,T P,T P,T Supplementary Figure S6. T T P,T T T ↓P^, ↑T T P,T P,T T T T P T
Legend – Supplementary Figure S6. The expression and/or methylation statuses of genes involved in mitogen-activated protein kinase (MAPK) signaling were altered in precancerous and tumor tissue. Microarray analysis was employed to identify uniquely active genes in precancerous liver tissue (P) and/or individual liver tumors (T), as described in the Methods. Functional annotation of 933 uniquely active genes (Fig. 1; Supplementary Tables S3G-I) was performed. Genes in blue font were active in at least 5/6 individual liver tumors (unbolded), or active in at least 5/6 precancerous liver samples and 5/6 individual liver tumors (bolded). Expression was up-regulated (red symbols), down-regulated (green symbols), or changed in opposite directions in precancerous liver tissue and individual liver tumors (orange symbols; ↑ and ↓). The tissue (P or T) is underlined one time if the expression change was confirmed by quantitative real-time PCR (qRT-PCR), two times if qRT-PCR revealed a unique expression change which was not detected by microarray analysis, or three times if there was an indication of a unique expression change (see Methods). Genes not selected for confirmation by qRT-PCR lack underlining and asterisks. qRT-PCR analysis of Fgf21 expression confirmed its up-regulation in individual liver tumors, while there was a statistically significant decrease in expression in precancerous liver tissue (^). Positive ( ) or negative ( ) regulation is illustrated, and the shapes of the entities represent the specific class of molecules to which the gene belongs: extracellular proteins ( ), ligands ( ), kinases ( ), transcription factors ( ), phosphatases ( ), and membrane receptors ( ).
P,T Supplementary Figure S7. T T T∞ T P,T P*,T* T P**,T* T T* P T T T T T
Legend – Supplementary Figure S7. The expression and/or methylation statuses of genes involved in angiogenesis were altered in precancerous and tumor tissue. Microarray analysis was employed to identify uniquely active genes in precancerous liver tissue (P) and/or individual liver tumors (T), as described in the Methods. Functional annotation of 933 total uniquely active genes (Fig. 1; Supplementary Tables S3G-I) was performed. Genes in blue font were active in at least 5/6 individual liver tumors (unbolded), or at least 5/6 precancerous liver samples and 5/6 individual liver tumors (bolded). Expression was up-regulated (red symbols) or down-regulated (green symbols). The tissue (P or T) is underlined one time if the expression change was confirmed by quantitative real-time PCR (qRT-PCR) or three times if there was an indication of a unique expression change (see Methods). Genes not selected for confirmation by qRT-PCR lack underlining and asterisks. If a gene, identified from a unique PB-induced region of altered DNA methylation (RAM) in precancerous liver tissue and/or individual liver tumors (Phillips and Goodman, 2009), exhibited a unique expression change based on qRT-PCR, this is denoted by a red symbol and an asterisk (*), while an indication of a unique expression change is represented by a red symbol and 2 asterisks (**). If there was no indication of an expression change, the gene is depicted by a gray symbol and an asterisk. Anxa2 (∞) was uniquely active in individual liver tumors (Supplementary Table S3I) and exhibited a unique RAM. Positive ( ) or negative ( ) regulation is illustrated, and the shapes of the entities represent the specific class of molecules to which the gene belongs: extracellular proteins ( ), ligands ( ), kinases ( ), and membrane receptors ( ).
Supplementary Figure S8. T P,T P T T P*,T* T P**,T** T P**,T* P T T T T T T T
Legend – Supplementary Figure S8. The expression and/or methylation statuses of genes involved in cytoskeleton organization/dynamics were altered in precancerous and tumor tissue. Microarray analysis was employed to identify uniquely active genes in precancerous liver tissue (P) and/or individual liver tumors (T), as described in the Methods. Functional annotation of 933 total uniquely active genes (Fig. 1; Supplementary Tables S3G-I) was performed. Genes in blue font were active in at least 5/6 precancerous liver samples (unbolded and underlined) or at least 5/6 individual liver tumors (unbolded). Expression was up-regulated (red symbols) or down-regulated (green symbols). The tissue (P or T) is underlined one time if the expression change was confirmed by quantitative real-time PCR (qRT-PCR). Genes not selected for confirmation by qRT-PCR lack underlining and asterisks. If a gene, identified from a unique PB-induced region of altered DNA methylation (RAM) in precancerous liver tissue and/or individual liver tumors (Phillips and Goodman, 2009), exhibited a unique expression change based on qRT-PCR, this is denoted by an asterisk (*), while an indication of a unique expression change is represented by 2 asterisks (**). Positive ( ) or negative ( ) regulation is illustrated, and shapes of the entities represent the specific class of molecules to which the gene belongs: extracellular proteins ( ), kinases ( ), and membrane receptors ( ).
Supplementary Figure S9. T ↑P, ↓T≠ T T T T T T T T P*,T* T T∞ T T* P**,T* T T T T T T T T T
Legend – Supplementary Figure S9. The expression and/or methylation statuses of genes involved in adhesion were altered in precancerous and tumor tissue. Microarray analysis was employed to identify uniquely active genes in precancerous liver tissue (P) and/or individual liver tumors (T), as described in the Methods. Functional annotation of 933 total uniquely active genes (Fig. 1; Supplementary Tables S3G-I) was performed. Genes in blue font were active in at least 5/6 precancerous liver samples (unbolded and underlined), or at least 5/6 individual liver tumors (unbolded). Expression was up-regulated (red symbols), down-regulated (green symbols), or changed in opposite directions in precancerous liver tissue and individual liver tumors (orange symbols; ↑ and ↓). The tissue (P or T) is underlined one time if the expression change was confirmed by quantitative real-time PCR (qRT-PCR). qRT-PCR analysis of Cdh1 expression confirmed its up-regulation in precancerous liver tissue, but not its down-regulation in individual liver tumors (≠). Genes not selected for confirmation by qRT-PCR lack underlining, asterisks, and a ‘not equal’ symbol (≠). If a gene, identified from a unique PB-induced region of altered DNA methylation (RAM) in precancerous liver tissue and/or individual liver tumors (Phillips and Goodman, 2009), exhibited a unique expression change based on qRT-PCR, this is denoted by a red symbol and an asterisk (*), while an indication of a unique expression change is represented by a red symbol and 2 asterisks (**). If there was no indication of an expression change, the gene is depicted by a gray symbol and an asterisk. Anxa2 (∞) was uniquely active in individual liver tumors (Supplementary Table S3I) and exhibited a unique RAM. Positive ( ) or negative ( ) regulation is illustrated, and the shapes of the entities represent the specific class of molecules to which the gene belongs: extracellular proteins ( ), ligands ( ), kinases ( ), and membrane receptors ( ).
P,T P,T Supplementary Figure S10. T ↓P^, ↑T T T T ↑P§, ↑T T T P,T T* T
Legend – Supplementary Figure S10. The expression and/or methylation statuses of genes involved in the epithelial-mesenchymal transition (EMT) were altered in precancerous and tumor tissue. Microarray analysis was employed to identify uniquely active genes in precancerous liver tissue (P) and/or individual liver tumors (T), as described in the Methods. Functional annotation of 933 uniquely active genes (Fig. 1; Supplementary Tables S3G-I) was performed. Genes in blue font were active in at least 5/6 individual liver tumors (unbolded), or active in at least 5/6 precancerous liver samples and 5/6 individual liver tumors (bolded). Expression was up-regulated (red symbols), down-regulated (green symbols), or changed in opposite directions in precancerous liver tissue and individual liver tumors (orange symbols: ↑ and ↓). The tissue (P or T) is underlined one time if the expression change was confirmed by quantitative real-time PCR (qRT-PCR), two times if qRT-PCR revealed a unique expression change which was not detected by microarray analysis, or three times if there was an indication of a unique expression change (see Methods). qRT-PCR analysis of Fgf21 expression confirmed its up-regulation in individual liver tumors, while there was a statistically significant decrease in expression in the precancerous tissue (^). There was an indication of up-regulation of Wnt5a expression in precancerous liver tissue (§). Genes not selected for confirmation by qRT-PCR lack underlining, asterisks, and a carrot symbol (^). If a gene, identified from a unique PB-induced region of altered DNA methylation (RAM) in precancerous liver tissue and/or individual liver tumors (Phillips and Goodman, 2009), exhibited a unique expression change based on qRT-PCR, this is denoted by an asterisk (*). Positive ( ) or negative ( ) regulation is illustrated, and the shapes of the entities represent the specific class of molecules to which the gene belongs: extracellular proteins ( ), ligands ( ), kinases ( ), transcription factors ( ), and membrane receptors ( ).
P,T P,T Supplementary Figure S11. T T T P,T T T T T T P,T T T T
Legend – Supplementary Figure S11. The expression and/or methylation statuses of genes involved in transforming growth factor-beta (TGF-beta) signaling were altered in precancerous and tumor tissue. Microarray analysis was employed to identify uniquely active genes in precancerous liver tissue (P) and/or individual liver tumors (T), as described in the Methods. Functional annotation of 933 uniquely active genes (Fig. 1; Supplementary Tables S3G-I) was performed. Genes in blue font were active in at least 5/6 individual liver tumors. Expression was up-regulated (red symbols) or down-regulated (green symbols). The tissue (P or T) is underlined one time if the expression change was confirmed by quantitative real-time PCR (qRT-PCR), or two times if qRT-PCR revealed a unique expression change which was not detected by microarray analysis. Genes not selected for confirmation by qRT-PCR lack underlining. Positive ( ) or negative ( ) regulation is illustrated, and the shapes of the entities represent the specific class of molecules to which the gene belongs: extracellular proteins ( ), ligands ( ), kinases ( ), transcription factors ( ), and membrane receptors ( ).
Supplementary Figure S12. T ↑P, ↓T T ↑P§, ↑T T T T T P,T T T T P,T T T* P**,T**
Legend – Supplementary Figure S12. The expression and/or methylation statuses of genes involved in Wingless (Wnt) signaling were altered in precancerous and tumor tissue. Microarray analysis was employed to identify uniquely active genes in precancerous liver tissue (P) and/or individual liver tumors (T), as described in the Methods. Functional annotation of 933 uniquely active genes (Fig. 1; Supplementary Tables S3G-I) was performed. Genes in blue font were active in at least 5/6 individual liver tumors (unbolded), or active in at least 5/6 precancerous liver samples and 5/6 individual liver tumors (bolded). Expression was up-regulated (red symbols) or changed in opposite directions in precancerous liver tissue and individual liver tumors (orange symbols: ↑ and ↓). The tissue (P or T) is underlined one time if the expression change was confirmed by quantitative real-time PCR (qRT-PCR). There was an indication of up-regulation of Wnt5a expression in precancerous liver tissue (§). Genes not selected for confirmation by qRT-PCR lack underlining and asterisks. If a gene, identified from a unique PB-induced unique region of altered DNA methylation (RAM) in precancerous liver tissue and/or individual liver tumors (Phillips and Goodman, 2009), exhibited a unique expression change based on qRT-PCR, this is denoted by an asterisk (*), while an indication of a unique expression change is represented by 2 asterisks (**). Positive ( ) or negative ( ) regulation is illustrated, and the shapes of the entities represent the specific class of molecules to which the gene belongs: extracellular proteins ( ), ligands ( ), and transcription factors ( ).
Supplementary Figure S13. T P**,T* P*,T* P P**,T*
Legend – Supplementary Figure S13. The expression and/or methylation statuses of genes involved in Notch signaling were altered in precancerous and tumor tissue. Microarray analysis was employed to identify uniquely active genes in precancerous liver tissue (P) and/or individual liver tumors (T), as described in the Methods. Functional annotation of 933 uniquely active genes (Fig. 1; Supplementary Tables S3G-I) was performed. Genes in blue font were active in at least 5/6 individual liver tumors. Expression was up-regulated (red symbols) or down-regulated (green symbols). Genes not selected for confirmation by quantitative real-time PCR (qRT-PCR) lack asterisks. If a gene, identified from a unique PB-induced unique region of altered DNA methylation (RAM) in precancerous liver tissue and/or individual liver tumors (Phillips and Goodman, 2009), exhibited a unique expression change based on qRT-PCR, this is denoted by an asterisk (*), while an indication of a unique expression change is represented by 2 asterisks (**). Positive ( ) or negative ( ) regulation is illustrated, and the shapes of the entities represent the specific class of molecules to which the gene belongs: extracellular proteins ( ), kinases ( ), and ligands ( ).
Supplementary Figure S14. T T ↑P, ↓T T
Legend – Supplementary Figure S14. The expression and/or methylation statuses of genes involved in Hedgehog signaling were altered in precancerous and tumor tissue. Microarray analysis was employed to identify uniquely active genes in precancerous liver tissue (P) and/or individual liver tumors (T), as described in the Methods. Functional annotation of 933 uniquely active genes (Fig. 1; Supplementary Tables S3G-I) was performed. Genes inblue font were active in at least 5/6 individual liver tumors. Expression was up-regulated (red symbols), down-regulated (green symbols), or changed in opposite directions in precancerous liver tissue and individual liver tumors (orange symbols: ↑ and ↓). The tissue (P or T) is underlined one time if the expression change was confirmed by quantitative real-time PCR (qRT-PCR). Genes not selected for confirmation by qRT-PCR lack underlining. Positive ( ) or negative ( ) regulation is illustrated, and the shapes of the entities represent the specific class of molecules to which the gene belongs: extracellular proteins ( ), ligands ( ), and membrane receptors ( ).
Supplementary Figure S15. 5’ 3’ 10 kb 2 kb 2 kb 10 kb 1) Associated with a gene A. Within a gene i. Spans transcriptional start site ( ) and/or 5’ untranslated region ii. Exon iii. Intron B. Upstream from transcriptional start site i. < 2 kb ii. < 10 kb and > 2 kb C. Downstream from last exon/intron i. < 2 kb ii. < 10 kb and > 2 kb 2) > 10 kb away from either the transcriptional start site or the last exon/intron 3) Repeat element: multiple “top” hits and one/several are associated with a gene(s) 4) Repeat element: multiple “top” hits and no hits are associated with a gene(s)
Legend – Supplementary Figure S15. Classification of unique phenobarbital (PB)-induced regions of altered DNA methylation (RAMs) based on their genomic locations, as determined by BLAST-like Sequence Alignment Tool (BLAT) searches (UCSC Genome Browser, July 2007 Mouse Assembly). Unique PB-induced RAMs in precancerous liver tissue and/or individual liver tumors, as compared to liver tissue from constitutive active/androstane receptor (CAR) knockout (KO), 23-week PB-treated mice, were cloned and subjected to BLAT searches (http://genome.ucsc.edu/cgi-bin/hgBlat?command=start&org=mouse). Depending on where, in relation to a gene, the RAM aligned, it was assigned a particular genomic classification (Phillips and Goodman, 2009). For example, RAMs designated as 1.B.i. are located less than or equal to 2 kilobases (kb) upstream from the transcriptional start site (TSS).