Supplementary information
Supplementary information EFhd2/ Swiprosin-1 is a common genetic determinator for sensation seeking/ low anxiety and alcohol addiction

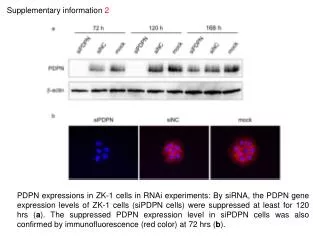
Supplementary information
E N D
Presentation Transcript
Supplementary information EFhd2/ Swiprosin-1 is a common genetic determinator for sensation seeking/ low anxiety and alcohol addiction Dirk Mielenz1§, Martin Reichel2§, Tiaynye Jia3§, Erin Burke Quinlan3§, Thomas Stöckl2, Melissa Mettang2, Daniel Zilske2, Elif Kirmizi-Alsan2, Penelope Schönberger2, Marc Praetner2, Sabine E. Huber2, Davide Amato2, Marc Schwarz4, Pavitra Purohit1, Sebastian Brachs5,6, Joachim Spranger5,6, Andreas Hess7, Christian Büttner8, Arif B. Ekici8, Francesc Perez-Branguli9, Beate Winner8,9, Verena Rauschenberger10, Tobias Banaschewski11, Arun L.W. Bokde12, Christian Büchel13, Patricia J.Conrod14,15, Sylvane Desrivières16, Herta Flor17, Vincent Frouin18, Jürgen Gallinat19, Hugh Garavan20, Penny Gowland21, Andreas Heinz22, Jean-Luc Martinot23, Herve Lemaitre24, Frauke Nees17, Tomáš Paus25, Michael N. Smolka26, IMAGEN consortium, Alexandra Schambony10, Tobias Bäuerle4, Volker Eulenburg27, Christian Alzheimer28, Anbarasu Lourdusamy29, Gunter Schumann16§, Christian P. Müller2§
OF EPM NSF FST SP 0 5 10 15 20 25 30 35 days Time line of behavioral testing OF – open field EPM – elevated plus maze NSF – novelty suppressed feeding FST – forced swim test SP – sucrose preference test Suppl. Fig. 1: Time line of behavioural testing in naïve EFhd2 knock out and wild type mice. Supplementary Figure 1
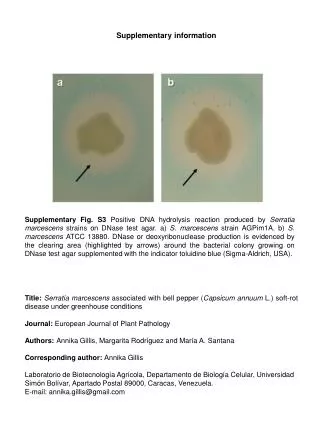
EFhd2 expression in the mouse RNA isolation and PCR Adult naïve EFhd2 KO and WT mice were sacrificed by cervical dislocation and brains and spleens were immediately harvested and frozen on dry ice. Brain areas of interest were cut from coronal sections of 1-mm thickness according to anatomical coordinates taken from the Franklin & Paxinos (1997) mouse brain atlas. Total RNA from prefrontal cortex (PFC), Nucleus accumbens (Ncl. Acc.) and the ventral tegmental area (VTA), and the spleen was isolated with RNeasy Mini Kit (Qiagen, Hilden, Germany) according to manufacturers’ instructions. Tissue was mechanically homogenized in the lysis buffer using a TissueLyser LT bead mill and stainless steel beads (Qiagen, Hilden, Germany). Isolated RNA was dissolved in RNAse-free water and stored at -80 °C. RNA quality and quantity was assessed on a Nanodrop ND-1000 UV-Vis spectrophotometer. RNA quality and quantity was assessed with an Agilent 2100 Bioanalyzer (Agilent Technologies, Santa Clara, CA) and a Nanodrop ND-1000 UV-Vis spectrophotometer (NanoDrop Technologies, Rockland, DE). For convential PCR 0.5 µg of RNA was reversely transcribed into cDNA using SuperScript VILO cDNA synthesis kit (Life Technologies, Darmstadt, Germany) according to manufacturers’ instructions. After completion and termination of the RT reaction, cDNA was diluted with 90 µl LowTE and stored at -20 °C. PCR was performed as previously described (Avramidou et al., 2007). Briefly, cDNAs were amplified with Taq polymerase (Genaxxon Bioscience, Biberach, Germany) with 35 cycles and 55°C annealing temperature with efhd2 primers (5´-TTCCTTCTGATCTTCCGCAAGGC-3´, Exon 3, and 5´-CTACTTGAACGTGGACTGCAG-3´, Exon 4). Hypoxanthine-guanine-phosphoribosyl-transferase (HPRT) specific primers (5´-GCTGTTGAAAAGGACCTCT-3´ and 5´-CACAGGACTACACCTGC-3‘) were used for normalization. RT-PCR products were visualized by ethidium bromide staining under UV light (Herolab, Wiesloch, Germany). References Avramidou A, Kroczek C, Lang C, Schuh W, Jack HM, Mielenz D (2007) The novel adaptor protein Swiprosin-1 enhances BCR signals and contributes to BCR-induced apoptosis. Cell Death Differ 14:1936-1947. Franklin KBJ, Paxionos G. The mouse brain in stereotaxic coordinates. 1997, San Diego: Academic Press.
WT KO WT KO Ncl. Acc. Ncl. Acc. Spleen Spleen PFC VTA PFC VTA H2O b 500 EFhd2 100 500 100 Hprt Suppl. Fig. 2: EFhd2 expression in the mouse brain. mRNA expression of EFhd2 determined by PCR of cDNA from the Nucleus accumbens (Ncl. Acc.), the prefrontal cortex (PFC), and the ventral tegmental area (VTA) of naïve adult EFhd2 knock out (KO) and wild type (WT) mice. cDNA of spleen served as control. PCR products were visualized by ethidiumbromide staining. Molecular mass standards are indicated on the left (b). Supplementary Figure 2
Suppl. Fig. 3: Weight gain of animals during establishment of alcohol drinking and subsequent escalation of consumption in EFhd2 KO mice. Day 0 represents the onset of alcohol availability in a two-bottle free choice test. A two-way ANOVA for repeated measures revealed a significant effect of time (F17,323=251,311; p<0.0001), but no effect of the genotype or interaction (p>0.05). Supplementary Figure 3
o EFhd2 WT (n = 5) ■ EFhd2 KO (n = 5) A B Suppl. Fig. 4: A pilot test of (A) food and (B) water consumption in EFhd2 KO and wild type (WT) mice during light and dark phase did not show evidence for altered consumatory behaviour. Mice were fed a high-fat diet (HFD; 60% kcal from fat, D12492, Research diets) for 12 weeks. Food and water intake was assessed in metabolic cages with a TSE LabMaster System (TSE Systems, Bad Homburg, Germany). Mice were acclimated to special drinking bottles 24 h and to the metabolic cages 6 h before starting the measurements. Mice were supplied with HFD, individually housed and data on food and water intake were collected for 48 h and analysed as (daily) average during light and dark phase. Supplementary Figure 4
Suppl. Fig. 5: Blood alcohol concentration in WT (n=12) and EFhd2 KO mice (n=10) after alcohol injection (3.5 g/kg, i.p.) at the time of loss of righting reflex testing. There was no difference in alcohol bioavailability between genotypes (p>0.05). Supplementary Figure 5
$ Suppl. Fig. 6: Sensation seeking like behaviour in EFhd2 KO mice can be reversed by chronic treatment with the anxiogenic drug b-carboline-3-carboxylate ethyl ester (b-CCE). b-CCE was administered s.c. by osmotic minipumps at a rate of 1.5 mg/kg/day. After 8-9 days of administration, an elevated plus maze (EPM) test revealed a reversal of high exploratory activity in the high anxiety loaded part of the EPM in EFhd2 KO mice (n=7/group) to the level of Wild type (WT, n=8-9/group) animals ($p<0.05, one-tailed t-test as measure of effect). Supplementary Figure 6
A. B. *** ** Suppl. Fig. 7: EFhd2 does not provide resilience for the establishment of conditioned reinforcing effects of alcohol in mice. (A) A conditioned place preference, tested at baseline (Bl) before learning, and after one (T1), three (T2), and seven (T3) conditioning trials, was established in both EFhd2 KO (n=16) and wild type (WT, n=16) mice at the same rate and extent (two-way ANOVA, factor time: F3,90=3.1117, p=0.0302). There was no significant genotype difference or interaction (p>0.05). (B) A significant decline in the number of entries during CPP establishment (F3,90=7.9175, p<0.0001)indicates that the time spent in the alcohol-paired compartment upon each visit increased significantly depending on the number of conditioning trials (**p<0.01, ***p<0.001; post hoc test for factor “time”). Supplementary Figure 7
A. B. Nac PFC Nac PFC * ** Suppl. Fig. 8: EFhd2 KO mice (n=9) show significantly enhanced extracellular (A) noradrenaline activity, but preserved (B) serotonin activity in the nucleus accumbens (Nac) and prefrontal cortex (PFC) under basal conditions compared to wild type (WT, n=9) mice as measured by in-vivo microdialysis in freely moving mice (*p<0.05, **p<0.01; vs. WT). Supplementary Figure 8
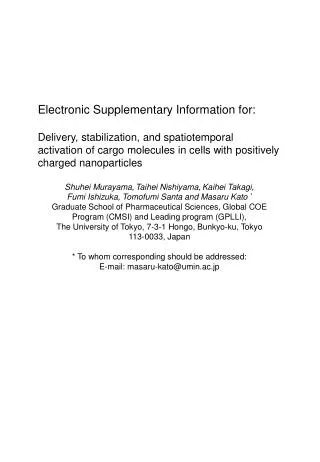
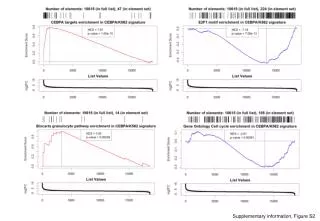
Results RNA expression analysis The two modules associated with genotype, Turquoise and Greenyellow, presented highly significant correlations between module membership (MM) and gene significance (GS) to the genotype trait (Fig. 5C and 5D). To explore the biological relevance of the modules, we determined enrichment of gene ontology (GO) terms. GO terms enriched in the Turquoise module (618 genes) included developmental process, cell surface receptor signalling pathway, dopamine biosynthetic process, and forebrain neuronal differentiation (Suppl. Tab. 1). We further performed pathway analysis and identified genes in the Turquoise module involved in axon guidance, chemokine signaling, glutamatergic synapse, focal adhesion, ECM receptor interaction and long term potentiation (Tab. 2). The Greenyellow module consisted of 172 genes that were enriched for metal ion transport (p=6.36×10-05), chemical homeostasis (p=8.56×10-05), positive regulation of fatty acid transport (p=9.81×10-05), channel activity (p=2.40×10-04), and calcium ion homeostasis (p=7.48×10-04; Suppl. Tab. 2). Genes represented in module Greenyellow are involved in MAPK signalling, focal adhesion, and mTOR signalling (Tab. 2). The alcohol-responsive modules also showed significant correlations between MM and GS to the treatment effect (Suppl. Fig. 6). A majority of genes in the yellow module were up regulated by alcohol compared to water consumption whereas all the genes in the three modules, Tan, Pink, and Purple, were down-regulated (Suppl. Fig. 7). GO term enrichment in the Yellow module (537 genes) included cellular carbohydrate metabolic process, response to chemical stimuli, dendritic spine growth, and acute inflammatory response (Suppl. Tab. 3). Pathway analysis revealed that genes included in the Yellow module and up-regulated in response to alcohol consumption are involved in chemokine, PPAR, calcium, JAK/STAT and phosphatidylinositol signalling as well as in long term potentiation and glutamatergic synapses (Tab. 3). GO term enrichment included dopamine transport and regulation of neuronal apoptotic processes in the Tan module (170 genes) (Suppl. Tab. 4), regulation of the MAPK cascade, integrin activation, and regulation of cell cycle in the pink module (295 genes) (Suppl. Tab. 5), and regulation of phosphoprotein phosphatase activity, magnesium ion binding, and regulation of mesenchymal cell proliferation in the purple module (192 genes) (Suppl. Tab. 6). Genes included in these modules and down-regulated by alcohol consumption were found to be involved in MAPK signalling pathway, tight junction, cell cycle, and axon guidance (Tab. 3).
A. B. C. D. Supplementary Figure 9: Scatter plot of correlations between gene significance (GS), i.e., differential expression between water and alcohol drinking mice (F-statistics from the ANOVA model) and module membership (MM) for Tan, Pink, Purple, and Yellow modules. Supplementary Figure 9
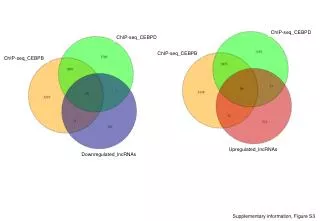
A. B. C. D. Supplementary Figure 10
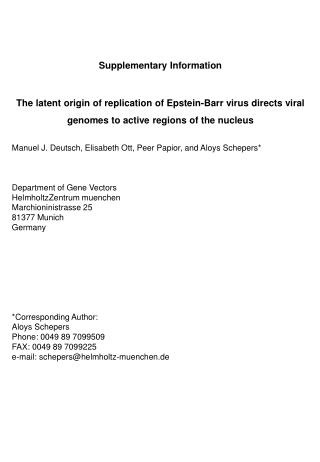
Suppl. Fig. 10: Heatmap of top 100 genes in (A) Yellow, (B) Tan, (C) Pink, and (D) Purple modules. In the heatmap, red represents high expression whereas green represents low expression values. Top bar indicates treatments: Antique brass – Saline; Antique fuchsa – Alcohol and the second top bar indicates genotypes: Amethyst - WT mice; Android green – EFhd2 KO mice. Supplementary Figure 10
B. A. C. E. D. F. Suppl. Fig. 11: Confirmation of significant genotype differences from microarray results by qPCR. There was a significant reduction in the expression of mRNA for (A) Doc2g, (B) S100a5, (C) Th, (D) Eomes, (E) Pax6 and (F) Efhd2 (p<0.0001) in Efhd2 knock out mice (p<0.05). Supplementary Figure 11
Suppl. Fig. 12: Expression of Eomes in Xenopus stage 32 tadpoles (scale bar: 1 mm). Supplementary Figure 12
PFC OB OB A SMC SMC SMC SMC HI HI VE VE B C Suppl. Fig. 13: Magnet resonance images as sagittal (A), coronal (B) and transversal (C) sections of the mouse brain for volumetric segmentation of the olfactory bulb (OB), prefrontal cortex (PFC), sensorimotor cortex (SMC), ventricles (VE) and hippocampus (HI). Supplementary Figure 13
Suppl. Fig. 14: Local Manhattan plot of results between EFHD2 common SNPs and life-time drinking frequency. The –log transformed P-values were plotted as diamond with its corresponding axis on the left, where top finding rs112146896 was highlighted as an enlarged red diamond. The recombination frequencies of the presented region were shown as the light blue line with its axis on the right. The location and direction of EFHD2 and surrounding genes were presented as green arrow at the bottom of the figure. Supplementary Figure 14
B. A. C. Suppl. Fig. 15: Boxplot of (A) lifetime drinking frequency, (B) lifetime 5-times binge frequency and (C) mean of anxiety sensitivity based on the frequency of minor allele C of SNP rs112146896. Because SNP rs112146896 were imputed, and no homozygote of minor allele was predicted, i.e. all imputed dosage values fall between 0.0 and 1.0, we therefore dichotomize the sample at 0.5 for illustration purpose, i.e. dosage value <0.5 was considered as 0 and dosage value >0.5 was considered as 1. Under the present dichotomization, all findings were still significant: for (A) , N(0)= 1756, N(1)=17, t=-3.6353, df=1771, p=2.86x10⁻⁴; for (B), N(0)= 1756, N(1)=17, t=-2.6584, df=1771, p=7.92x10⁻³; for (C), N(0)=1794, N(1)=16, t=2.9208, df=1808, p=3.54x10⁻³. Note that control variables were not included in the above analyses. Supplementary Figure 15
B. A. Suppl. Fig. 16: Scatterplot of the thickness of superior frontal gyrus with (A) the lifetime drinking frequency and (B) the lifetime 5-times binge drinking. The linear fitted lines in red were included for both figures. Supplementary Figure 16