Download
1 / 8
90 likes | 346 Vues
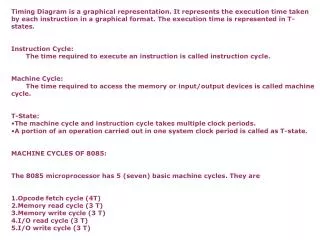
Timing Diagram is a graphical representation. It represents the execution time taken by each instruction in a graphical format. The execution time is represented in T-states. Instruction Cycle: The time required to execute an instruction is called instruction cycle. Machine Cycle:

E N D
Timing Diagram is a graphical representation. It represents the execution time taken • by each instruction in a graphical format. The execution time is represented in T-states. • Instruction Cycle: • The time required to execute an instruction is called instruction cycle. • Machine Cycle: • The time required to access the memory or input/output devices is called machine cycle. • T-State: • The machine cycle and instruction cycle takes multiple clock periods. • A portion of an operation carried out in one system clock period is called as T-state. • MACHINE CYCLES OF 8085: • The 8085 microprocessor has 5 (seven) basic machine cycles. They are • Opcode fetch cycle (4T) • Memory read cycle (3 T) • Memory write cycle (3 T) • I/O read cycle (3 T) • I/O write cycle (3 T)