Download
1 / 23
230 likes | 264 Vues
Learn about statistics in environmental science, from average calculations to probability understanding. Explore models used by scientists for analysis and discover the importance of data interpretation.

E N D
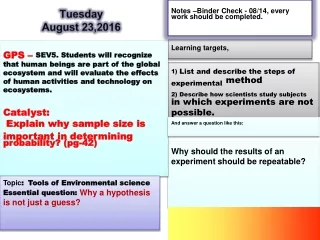
Notes –Binder Check - 08/14, everywork should be completed. TuesdayAugust 23,2016 Learning targets, GPS – SEV5. Students will recognize that human beings are part of the global ecosystem and will evaluate the effects of human activities and technology on ecosystems. Catalyst: Explain why sample size is important in determiningprobability? (pg-42) Our goal is 80% 1) List and describe the steps of experimentalmethod 2) Describe how scientists study subjects in which experiments are not possible. And answer a question like this: Why should the results of an experiment should be repeatable? Topic:Tools of Environmental science Essential question: Why a hypothesis is not just a guess?
Chapter 2 Tools of Environmental Science Section 2: Statistics and Models Day 1
How Scientists use Statistics • Statisticsis the collection and classification of data that are in the form of numbers. • Scientists rely on and use statistics to summarize, characterize, analyze, and compare data. • Statistics is actually a branch of mathematics that provides scientists with important tools for analyzing and understanding their data.
Statistics Works with Populations • Scientists use statistics to describe statistical populations. • A statistical population is a group of similar things that a scientist is interested in learning about.
What is the Average? • Statistical populations are composed of similar individuals, but these individuals often have different characteristics. • A mean is the number obtained by adding up the data for a given characteristic and dividing this sum by the number of individuals. • The mean provides a single numerical measure for a population and allows for easy comparison.
Distribution • Distributionis the relative arrangement of the members of a statistical population, and is usually shown in a graph. • The graphs of many characteristics of populations, such as the heights of people, form bell-shaped curves. • A bell shaped curve indicates a normal distribution where the data is grouped symmetrically around the mean.
What is the Probability? • Probabilityis the likelihood that a possible future event will occur in any given instance of the event. • Probability is usually expressed as a number between 0 and 1 and written as a decimal rather than as a fraction. • However, there must be a large enough sample size in order to obtain accurate results.
Understanding the News • The news contains statistics everyday. • For example, a reporter might say, “A study shows that forest fires increased air pollution in the city last year.” • This could lead you to gather and then graph data on the pollution levels for last 20 years, and looking to see if this years seem unusually high. • Paying attention to statistics will make you a better consumer of information.
Thinking About Risk • Riskis the probability of an unwanted outcome. • People often worry about big oil spills, but as the pie chart shows, there is a much greater risk of oil pollution from everyday sources.
Thinking About Risk • The most important risk we consider is the risk of death. • Most people overestimate the risk of dying from sensational causes, such as plane crashes, but underestimate the risk from common causes, such as smoking. • Likewise, most citizens overestimate the risk of sensational environmental problems and underestimate the risk of ordinary ones.
Models • Modelsare patterns, plans, representations, or descriptions designed to show the structure or workings of an object, system, or concept. • Scientists use several different types of models to help them learn about our environment.
Physical Models • Physical models are three-dimensional models you can touch. • Their most important feature is that they closely resemble the object or system they represent, although they may be larger or smaller. • The most useful models teach scientists something new and help to further other discoveries.
Physical Models • One of the most famous physical models was used to discover the structure of DNA. • The structural model was built based on the size, shape, and bonding qualities of DNA. • The pieces of the model put together helped the scientist figure out the potential structure of DNA. • Discovering the structure led the understanding of DNA replication.
Graphical Models • Maps and charts are the most common examples of graphical models. • Scientists use graphical models to show things such as the position of the stars, the amount of forest cover in a given area, and the depth of the water in a river or along a coast.
Conceptual Models • Conceptual models are verbal or graphical explanations for how a system works or is organized. • A flow-chart diagram is an example of a conceptual model. • A flow-chart uses boxes linked by arrows to illustrate what a system contains, how those contents are organized, and how they affect one another.
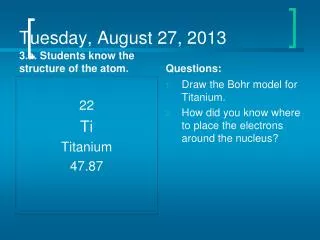
Conceptual Models • Conceptual models can also be verbal descriptions or even drawings. • For example, one conceptual model of the structure of an atom describes the atom as one large ball being circled by several smaller balls. • This illustrates another point, that a model can be more than one type. • An atomic model made using plastic balls is both a conceptual and physical model.
Mathematical Models • Mathematical models are one or more equations that represent the way system or process works. • Mathematical models are especially useful in cases with many variables, such as the many things that affect the weather.
Mathematical Models • Although mathematical models use number and equations, they are not always right. • People are the ones who interpret the data and write the equations. • Therefore, if the data or the equations are wrong, the model will not be realistic and will provide incorrect information. • Like all models, mathematical models are only as good as the data that went into building them.
Mathematical Models • Scientists use mathematical models to create amazing, as well as useful images. • “False color” satellite images are created using mathematical models. • Scientists use the models to relate the amount of energy reflected from objects to the objects’ physical condition.