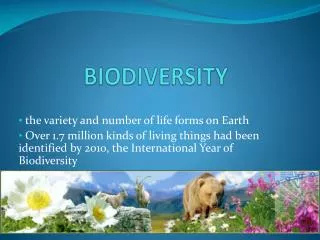
Biodiversity Crisis
Biodiversity Crisis. Two centuries of warnings from scientists of anthropogenic losses of species Since 1600s: 129 species of birds 83 species of mammals 21 species (including 100 subspecies) reptiles 7 species amphibians. Biodiversity Crisis. Freshwater

Biodiversity Crisis
E N D
Presentation Transcript
Biodiversity Crisis • Two centuries of warnings from scientists of anthropogenic losses of species • Since 1600s: • 129 species of birds • 83 species of mammals • 21 species (including 100 subspecies) reptiles • 7 species amphibians
Biodiversity Crisis • Freshwater • 40 species N. American fish during latter part of 20th century • Worldwide – 20% fish in jeopardy or extinct • Molluscs – 7% of 297 recognized species presumed extinct; another 65% endangered, threatened, or candidates for listing • Plants last 400 yr, 600 species (176 in US)
Linnaean Shortfall • 1.7 million species described • Estimated 5 – 30 million species • Species will go extinct before are known to science
Hotspots of Diversity • Patterns of diversity and endemism provide clues for locating rare and endangered species. Questions: • What are the locations of hotspots for particular taxonomic groups? • Do hotspots of taxa overlap? • Example – Endemic bird areas (EBAs) – where range of at least two restricted-range species present. Their pattern is not random
Prehistoric Extinctions • Permian • Cretaceous • Migration and radiation following linkages between continents • Formation of Pangaea • Laurasia • Great American Interchange • Pleistocene (climate-driven, at least partly)
Prehistoric Extinctions – last 2 million years • New world megafauna and human colonization • Aboriginal application of fire in Australia and Americas – broad range of plants and animals • Africa exception to human effects; species there evolved with humans and were able to adapt
Recent Historical Record of Extinctions • Insular extinction rate greater than continental rate
Human-related Species Introductions • Similar to continental convergences? • Most common species: common rabbit, cats, rats, house mice, pigs, cattle, goats, dogs • Part of “naturalization”; bring along a piece of home • Most common carnivores (19%) and artiodactyls (31%; deer and related ungulates) • Only represent 7% of fauna
Human-related Species Introductions • Mammal introductions to islands – 118 species, 30 families, and 8 orders • Birds – 212 species, 46 families, and 16 orders • Australia has received most introductions per unit area for continents
Habitat Fragmentation • Breaking up of large parts of ecosystems for agriculture and urbanization • Puts species in peril (details later) • Hardest hit are tropical rain forests • 7% Earth’s surface; 50% species • Madagascar – 7% left • Brazil Coastal Forest – 1% left • Singapore - <1%
Ecological Effects of Fragmentation • Reduction in total area, resources, and productivity of native habitats • Increased isolation of remnant fragments and their local populations • Significant changes in environmental characteristics of fragments, including solar radiation, wind, and water flux
Stages of Biotic Collapse • Stage 1: Initial exclusion – some populations not included in remnant patches • Stage 2: Extirpation due to lack of essential resources • Stage 3: Perils associated with small populations – genetic, demographic, stochastic problems
Stages of Biotic Collapse • Stage 4: Deleterious effects of isolation: rescues by recruitment diminished • Stage 5: Ecological imbalances: loss of interactions (mutualism, parasitism, commensals) and biotic regulation (predation, competition)
Biogeography of Climate Change • Periods of warming from greenhouse gas accumulation before • Difference is time over which it took place • Human activities have greatly escalated greenhouse gas concentrations over last 50 yr • Temp – Projected increase 1.5 – 6°C; mean ~2.5°C; 0.7°C since 1860 • End of Wisconsin – Temp incr. 4.5°C over 5000 yr (<1°C/1,000 yr); raised sea level 100 m
Biogeography of Climate Change • Biogeography helps predict changes in distributions, corridors, geographic isolation of species, and extinctions • Range change IS NOT just going to be temperature • Other abiotic factors must be in place • Just as in other events, e.g., Pleistocene, must be able to disperse and adapt to new conditions
Species-area relationship to predict change in species richness of boreal mammals in isolated mountain ranges of Great Basin (3°C increase
Freshwater Biota • 4°C increase in temperature • Increase mean annual runoff 9 – 21% • Shifts temporal runoff patterns (increase precipitation winter and spring, decrease summer and fall) • Lead to changes in water quality
Marine Biota • Latitudinal and vertical shifts in water temperature; warm waters toward poles and greater depths • Alters horizontal and vertical mixing of currents • Salinity near equator and higher latitudes will decrease (increased precipitation in those regions)
Connectivity and Corridors • Redistribution and loss of habitats will create new barriers for dispersal • Will also tend to increase isolation of patches in increasingly fragmented habitats (refer to human effects earlier)