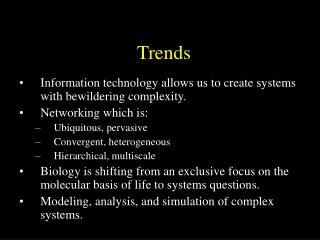
Trends
This report examines the trends in enrollment and graduation rates for undergraduate and graduate programs in Communication and Culture at the University. It reveals that 16.5% of the full-time frosh students from Fall 2002 did not progress to their second year. The average years to graduation are presented, along with a comparison of course loads and teaching quality from various years. Satisfaction surveys indicate varying levels of contentment among students regarding their academic experience. The report also reflects on course enrollment changes and faculty performance.

Trends
E N D
Presentation Transcript
Trends Communication & Culture
Undergraduate Attrition Rate Of the frosh who entered the University in Fall 2002, 16.5% did not progress to second year, whereas, 20.5% of the frosh who entered CC in Fall 2002 did not progress to second year.
Frosh Average Years to Graduation * 10-Year Graduation Rate
Undergraduate Course Load - CC Fall Term Half Course Equivalents
Overall Quality of Teaching 2006 CUSC 3.4% Increase • Students Graduating in 2005 and 2002 • 2005 Sample size 1000 (Response rate 53.2%)
Overall Quality of Education 2006 CUSC 7.3% Increase • Students Graduating in 2005 and 2002 • 2005 Sample size 1000 (Response rate 53.2%)
Satisfaction with decision to attend this university 2006 CUSC • Students Graduating in 2005 and 2002 • 2005 Sample size 1000 (Response rate 53.2%)
I would not recommend this university 2006 CUSC • Students Graduating in 2005 and 2002 • 2005 Sample size 1000 (Response rate 53.2%)
U of C Master’s Graduation Rate 85.1% * Combined Fall 1996, 1997, 1998 Cohorts
U of C PhD Graduation Rate 75.0% * Combined Fall 1996, 1997, 1998 Cohorts
Overall quality of teaching by faculty? 2007 Graduate and Professional Student Survey
If you were to start your grad program again, would you select the same faculty supervisor? 2007 Graduate and Professional Student Survey
If you were to start your graduate program again, would you select the same university? 2007 Graduate and Professional Student Survey
Would you recommend this university to someone considering your program? 2007 Graduate and Professional Student Survey
Course Enrolees CC taught 4.6% of the total course enrolments in Fall 2006. Students registered in the Faculty of CC generated 8.6% of the total course enrolments. * Includes Undergraduate and Graduate Students
Majors vs. Course Enrolees *% Student majors shows the percent of undergraduate and graduate students that are majoring in CC. This figure is expressed in terms of FTE. % Teaching shows the percent of course enrolees registered in courses taught by CC.
CC Course Enrolees by Faculty of Student Registration, Fall 2006 The total number of course enrolees taught by CC in Fall 2006 was 3,801. Of these 3,801 course enrolees, 55.5% were generated by Communication & Culture students, whereas, 11.3% were generated by students registered in the Faculty of Social Sciences. * OS is Open Studies
Annual Change in Course Enrolees Course enrolment in CC courses decreased by almost 15% in fall 2006. 2003 2004 2005 2006 * Includes Undergraduate and Graduate Students
Faculty Budgets Fund 10
U of C Faculty and Staff * 2006
U of C Faculty and Staff * 2006
Communication and Culture * 2006