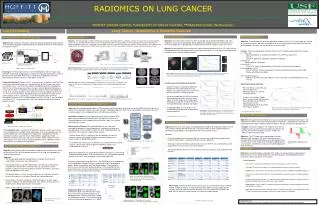
Advancing Lung Cancer Detection via Radiomics: A Quantitative and Semantic Approach
This study focuses on the development of innovative imaging biomarkers from diagnostic CT scans to improve lung cancer prognosis. By leveraging the varying clinical imaging protocols, we examined the reproducibility and prognostic value of quantitative descriptors capturing tumor shape and texture changes. Utilizing human tissue phantoms and retrospective assessments from the National Lung Screening Trial, we identified 25 key semantic features in lung lesions, establishing a scoring scheme for better classification and prediction of malignancy. This research aims to enhance lung cancer diagnosis through precise imaging analysis.

Advancing Lung Cancer Detection via Radiomics: A Quantitative and Semantic Approach
E N D
Presentation Transcript
RADIOMICS ON LUNG CANCER Robert Gillies* (PI), Robert Gatenby* (Co-PI), Dmitry Goldgof#, Philippe Lambin##, YoganandBalagurunathan*, Yuhua Gu*, Olya Grove*, Hua Wang*,Lawrence Hall#, Matthew Schabath*, Jhanelle Gray*, Eduardo Moros*, Thomas Dilling*, Jongphil Kim*, Anders Berglund*, Steven Eschrich*, Gregory Bloom*, John Heine*, Andre Dekker##, Hugo Aerts##, Emmanuel Rios## *MOFFITT CANCER CENTER,#UNIVERSITY OF SOUTH FLORIDA, ##MAASTRO CLINIC (Netherlands) Lung Screening Lung Cancer: Quantitative & Semantic Features Convexity Feature+$ : Semantic Features +%: Phantom Study +&: National Lung Screening Trial Lung$ Objective: One of the teams interest has been to develop new quantitative descriptors that show prognostic value and are reproducible. We developed two imaging biomarkers from diagnostic CT scans that capture the shape and texture changes within the tumor, using 2D stacks of CT scans. Objective: The heterogeneity in sample collection due to clinical and imaging differences between samples can impact on translational radiomicsstudies. It has to be noted that most clinical scans are obtained with different scan protocols. In order to quantify these changes and study the impact on radiomic features, we used human tissue phantoms that was scanned on three different scanners (Phillips, Siemens, GE) at different tube voltage (KVP). The Initial goal was to find features that were stable across the tube voltages and find the features that tracks density change. Objective: The conventionally observed radialogical characteristics in a CT Lung images are referred to as semantic features. We have converged on 25 most relevant features to describe the lung lesion and developed a semantic scoring scheme on a five point scale. Objective: We useNLST screening CT data and compute quantitative image features and retrospectively predict nodule progression, especially for those cases developing to malignant nodules. Method: We quantitatively demonstrated in the subset of adenocarcinoma (N = 62) CT studies that the developed biomarkers are capable of classifying patients based on CT scans alone into two prognostic categories within statically significant bounds • Features: We have developed 25 semantic features which is broadly categorized into five groups: • Tumor (16): • Space localization (4): Location, Distribution, Fissure/Pleural attachment. • Size (1) • Shape (4): Sphericity, Lobulation, Concavity, Irregularity. • b) Margin (2): • Border definition, Spiculation • c) Density (5): • Texture, Air space, Air bronchogram, Calcification, Enhancement heterogenity • d) Surrounding tissue (5): • Pleural retraction, Vascular convergence, Thickened adjacent bronchovascular bundle, Emphysema/Fibrosis periphery. • e) Associated findings (4): • Nodules in primary tumor lobe, Nodules in non-tumor lobes, Lymphadenopathy, Vascular invasion. Area=1201.6 mm2 Perimeter=152.4 mm Volume=2615 mm3 Surf. area=1099.33 mm2 Surf. Area/volume=0.42 mm-1 Density, Necrosis Mean = 19.33 HU SD = 76.59 HU Min = -249 HU Max = 118 HU Spiculations Slope at margin =133.5±31.3 HU/mm Low density inclusions Rel. vol.= 0.21 mm3 Number=110 Volume=4.89±8.35 mm3 Feature Report Analysis Longitudinal CT Image Nodule Detection and Segmentation (Courtesy: Dr. Reeves, Cornell University) Above: Tissue Characterization Phantom, Gammex 467 Above (Left to Right): CT scanners (Phillips Brilliance, Siemens Sensation 64 and GE Discovery STE) Experimental Setup: The tissue phantoms were scanned on three scanners with three different voltages. Due to scanner setting limitations tube currents were matched to close range between scanners. Above: Radiomics on Lung Nodules (c) Challenges: The NLST data consists of over 26, 000 patients with CT image study. Therefore selection of sub population is critical and the quantification process needs to be efficient and automated. Area of focus include: Data management, Curation, Segmenting the nodules (relatively small regions of interest). Above Figures. Subdividing the tumor region (a) region of interest and (b) region between the markings is the boundary used for the convexity measure (c) Kaplan-Meier plots for two groups formed by splitting the samples at the median value of convexity score. Top plot are the patients with higher convexity values. Above& Right: CT scanners setting and Phatoms scanned at different KVPs Cohort Identification$. Based on the CT screening results (negative vs. positive) from the baseline and two follow-up visits, we identified four distinct incident lung cancer case cohorts (CCs). Two of the case cohorts developed lung cancer following one (CC1) or two (CC2) prior positive screens that were not considered to indicate lung cancer (CC1/2=192). CC1 patients had a positive screen at T0 then developed lung cancer at T1; CC2 had positive screens at T0 and T1 then developed lung cancer at T2. The other two case cohorts developed lung cancer following one (CC3) or two (CC4) negative screens (CC3/4=125). CC3 had a negative screen at T0 then developed lung cancer at T1; CC4 had negative screens at T0 and T1 then developed lung cancer at T2. The prevalent cases (PCs) were diagnosed with lung cancer at baseline (N=297). Results: About 31 features had coefficient of variation (CV) less than 10% , 10 feature in the range of 10 to 20%CV, while about 178 features have CV over 20% for different KVP’s and scanners. • Location-specific entropy-based markers: • we believe that by evaluating the difference between the core and the boundary sub-regions, we made the feature less sensitive to the inconsistencies in image formation. • we not only computed the statistics based on the entropy filtering across the entire tumor region for all the image slices containing the tumor, but also kept the record for the values in the predefined core and edge sub-regions. • Using Kaplan-Meier survival analysis, we evaluated the performance of entropy-based imaging biomarker. • Experimental Setup & Results: • We used 109 non small cell Lung cancer samples with Adenocarcinomas to score the semantic features. • Using the survival plots (Kaplan-Meier) we have found significance for three semantic features: Pleural attachment (P < 0.01), Lymphadenopathy (P =0.03) and Air-Bronchogram (p=0.02). +& Contributions: Drs. Budzevich & Moros Figure Above. CV across different tube voltages (KVP) for features related to Pixel Intensity for Phillips, GE and Siemens scanner. Feature Repeatability+# & Prognosis +# # : Objective: We evaluated reproducibility of 219 three-dimensional quantitative image features on the RIDER test/retest data set. A subset of non redundant features was used to predict radiologist prognostic score. These reproducible set of features were then tested for prognosis on a independent data set (59 Adenocarcinomas). Above. Kaplan-Meier survival plots for Pleural attachment & Lympho-adenopathy features are shown to be significant in adenocarcinomas. Above Figure : The Kaplan-Meier plots for two sample groups formed by splitting the samples at the median values of their entropy value, measured for (a) entire region of interest (b) the boundary (c) the core of the tumors (d) between the core +% (in Review): Hua et.al, J. Thor. Onc. Clinical Trial: Dasatinib +$ (in Review): Grove et.al, J. Thor. Onc. QuantitativeFeatures: On the segmented tumor region of interest (ROI) about 219 three dimensional features were extracted. The features are broadly divided into seven category that describe the shape, size, location and texture of the tumor. Objective: We hypothesize that Radiomicsanalysis would be able to identify image features that would discriminate the cohort into responder and non-responders, retrospectively. These feature may prospectively help us to better monitor the patients therapy and adjust the dosage levels. Survival Prediction #^ Representative Features: The repeatable features that show high concordance between test/retest experiments, large dynamic range and non-dependent are the needed characteristics for a reliable biomarker, we referred to such a subset as representative features. Objective: We use CT-scan images to develop predictive models for lung cancer patient survival time. Patients afflicted with Non-Small Cell Lung Cancer (NSCLC) were studied towards the development of providing a novel approach to non-invasive tumor analysis. Above: Cohort selection in NLST Screening data. Samples: A cohort of 19 patients (12 Progressive Disease, 5 Stable Disease and 2 with Partial Response) has been in the trial with Pre and Post-treatment CT scans, within 4 to 6 weeks of administering the drug. CT screening results. Using the NLST definitions, positive screens are CT scans that revealed any non-calcified nodule measuring ≥ 4 mm in any diameter and non-calcified nodule/mass(es) “suspicious for” lung cancer. Adenopathy or effusion could be classified as a positive result. Abnormalities suggesting clinically significant conditions other than lung cancer also were noted. Negative screens were defined as CT scans with no significant abnormalities or significant or minor abnormalities not suspicious for lung cancer. • Results: • A variety of predictive classification models of survival were used including support vector machines, Naive Bayes, rule based, and decision trees algorithms. • Testing was done on 40 NSCLC adenocarcinoma cases. Relief-F was used to identify useful image features from an initial set of 219 3D features. • We achieve promising results of 77.5% accuracy with only 5 features using a Decision Tree classifier Dynamic Range (DR): It is defined as the ratio between the covered range of a feature with respect to difference between repeats, in the given sample set. Standardized to [0 1]. Approach: The CT images were segmented by a trained radiologist with the help of CAD tools, Radiomics features extracted. A best discriminating feature was identified based on classifier analysis with various error estimations appropriate for small samples. A combination of features would be appropriate for discrimination. Figure Above. Process flow in the Test/Retest study Above: Waterfall plot of radiomic features that tracks Stable (green) and progressive (red) disease. $ (in preparation) Schabath et.al Concordance Correlation (ρc): It is defined as the ratio between the covered range of a feature with respect to difference between repeats, and standardized to cover [0 1]. Normal Lung Characterization %%: Database: Objective: We intend to study the quantitative image features characteristics across the normal lung. This will also provide a base line set to study the repeatability of the quantitative features. Redundancy Reduction (R2 ):Dependency between the features is quantified by Coefficient of determination. To find an informative set, the featured are grouped at different levels of R2 and replaced by a feature with highest DR. Objective: A mineable database with patient CT images, clinical parameters and quantitative image features in a centralized location will accelerate discovery and collaboration among researchers with-in and across the institutions. • Approach: • The new designed lung field segmentation also includes bronchial tree segmentation and vascular tree segmentation. • After getting the pure Lung field segmentation, the next step is to divide the lung field into 8 sub-volumes (1-level division), 32 sub-volumes (2-level division) in order to extract texture features for each sub-volumes. (The level of division depends on the need). • This division process is trivial, (for each region (ex: left lung field), locate the center of the region first and draw a Z-plane and Y-plane separately). • Extract features for each sub-volume. 180 texture features for each region includes: histogram, wavelet decomposition, laws feature, co-occurrence, run-length features. Shape features were not included. • Obtain natural range for each feature and reproducibility. • Current Features: • An instance of ClearCanvasImageServer has been installed as a research PACS • The Moffitt V2 data set with images, clinical data and image features has been loaded. • Additional CT scans has been sent to Clear Canvas for inclusion in validation and additional datasets • A easy-to-use web-based interface has been developed to manage the images in a project oriented fashion. • Example of functionality includes, csv exports of all linked data, batch export of CT images to a work directory for image analysis using Definiens or other software • Additional tools, such as XNAT, are continuously being evaluated for an improved ability to share the data between institutions. • Major effort to curate and rename the NLST cohort is underway. This will ensure unique names to the CT scans and will enable automatic retrial of the images through the Database. Prediction of Radiologist Prognostic Score : The RIDER data was scored based on fiver radiological semantic features, standardized to form two prognostic groups : Better (over median) and Poor (below median). The quantitative features were used to predict prognostic groups, of the repeatable features conventional size & few texture based features showed predictive potential (AUC > 0.7) using linear discriminant functions. Above. Runlength (GLN) feature discriminating prognostic group. The top panel shows slice and 3D of better prognostic tumor while bottom panel shows poor prognostic group. Above Table: Summary of leave-one-out accuracy results containing the feature selection method, number of features, average accuracy, lower quartile accuracy, upper quartile accuracy, and area under the receiver operating curve. The top accuracy and AUC are bold. The LQ represents Lower Quartile, UQ represents Upper quartile. Independent Data: The repeatable and informative features from the test/retest study was used to test its prognostic potential in an independent Non small cell lung cancer sample set (59 Adenocarcinoma). The Runlength (GLN) feature was found to be prognostic (P <= 0.046) Left: Different views of the lung filed segmentation. +#Balagurunathan et.al, J. Dig. Imaging, 2013(in review) +##Balagurunathan et.al, J. Tran. Oncology, 2014 (Accepted, in press) #^(submitted): S. Hawkins, et.al,USF Acknowledgement: This work is supported by NIH U01 CA143062 and Florida State’s James & Esther King Grant #2KT01 %% (in collaboration with) Chinese Academy of Sciences.