Infrared (IR) Spectroscopy
780 likes | 2.08k Vues
Infrared (IR) Spectroscopy. IR deals with the interaction of infrared radiation with matter. The IR spectrum of a compound can provide important information about its chemical nature and molecular structure.

Infrared (IR) Spectroscopy
E N D
Presentation Transcript
Infrared (IR) Spectroscopy • IR deals with the interaction of infrared radiation with matter. The IR spectrum of a compound can provide important information about its chemical nature and molecular structure. • Most commonly, the spectrum is obtained by measuring the absorption of IR radiation, although infrared emission and reflection are also used. • Widely applied in the analysis of organic materials, also useful for polyatomic inorganic molecules and for organometallic compounds.
Overview • Electromagnetic radiation • Vibrations • Principle of IR experiment • IR spectrum • Types of vibration • CGF/Fingerprint regions • IR activity of vibrations • Interpretation of IR spectra • Instrumentation • Sample preparation
Electromagnetic Radiation The propagation of electromagnetic radiation in a vacuum is constant for all regions of the spectrum (= velocity of light): c = × 1 Å = 10 –10 m 1 nm = 10 –9 m 1 m = 10 –6 m Another unit commonly used is the wavenumber, which is linear with energy: Work by Einstein, Planck and Bohr indicated that electromagnetic radiation can be regarded as a stream of particles or quanta, for which the energy is given by the Bohr equation:
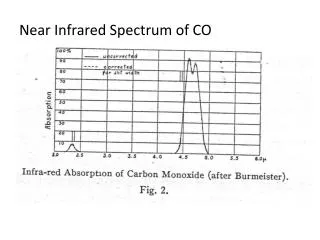
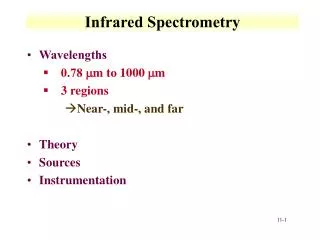
Infrared region LIMIT OF RED LIGHT: 800 nm, 0.8 m, 12500 cm-1 NEAR INFRARED: 0.8 -2.5 m, 12500 - 4000 cm-1 MID INFRARED: 2.5 - 50 m, 4000 - 200 cm-1 FAR INFRARED:50 - 1000 m, 200 - 10 cm-1 Divisions arise because of different optical materials and instrumentation.
Molecular spectra • There are three basic types of optical spectra that we can observe for molecules: • Electronic or vibronic spectra (UV-visible-near IR) • (transitions between a specific vibrational and rotational level of one electronic state and a vibrational and rotational level of another electronic state) • Vibrational or vibrational-rotational spectra (IR region) • (transitions from the rotational levels of one vibrational level to the rotational levels of another vibrational level in the same electronic state) • Rotational spectra (microwave region) • (transitions between rotational levels of the same vibrational level of the same electronic state)
Vibrational spectra (I): Harmonic oscillator model • Infrared radiation in the range from 10,000 – 100 cm –1 is absorbed and converted by an organic molecule into energy of molecular vibration –> this absorption is quantized: A simple harmonic oscillator is a mechanical system consisting of a point mass connected to a massless spring. The mass is under action of a restoring force proportional to the displacement of particle from its equilibrium position and the force constant f (also k in followings) of the spring.
• The vibrational energy V(r) can be calculated using the (classical) model of the harmonic oscillator: • Using this potential energy function in the Schrödinger equation, the vibrational frequency can be calculated: The vibrational frequency is increasing with: • increasing force constant f = increasing bond strength • decreasing atomic mass • Example: f cc > f c=c > f c-c
Vibrational spectra (II): Anharmonic oscillator model The actual potential energy of vibrations fits the parabolic function fairly well only near the equilibrium internuclear distance. The Morse potential function more closely resembles the potential energy of vibrations in a molecule for all internuclear distances-anharmonic oscillator model. Fig. 12-1
EVIB= ( En+1 – En) =h× osc • The energy difference between the transition from n to n+1 corresponds to the energy of the absorbed light quantum • The difference between two adjacent energy levels gets smaller with increasing n until dissociation of the molecule occurs (Dissociation energy ED ) Note: Weaker transitions called “overtones” are sometimes observed. These correspond to =2 or 3, and their frequencies are less than two or three times the fundamental frequency (=1) because of anharmonicity. Typical energy spacings for vibrational levels are on the order of 10-20 J. from the Bolzmann distribution, it can be shown that at room temperature typically 1% or less of the molecules are in excited states in the absence of external radiation. Thus most absorption transitions observed at room temperature are from the =0 to the =1 level.
Vibrational spectra (III): Rotation-vibration transitions The vibrational spectra appear as bands rather than lines. When vibrational spectra of gaseous diatomic molecules are observed under high-resolution conditions, each band can be found to contain a large number of closely spaced components— band spectra. The structure observed is due to that a single vibrational energy change is accompanied by a number of rotational energy changes. The form of such a vibration-rotation spectrum can be predicted from the energy levels of a vibrating-rotating molecule. –> “vibrational-rotational bands” A vibrational absorption transition from to +1 gives rise to three sets of lines called branches: Lower-frequency P branch: =1, J=-1; Higher-frequency R branch: =1, J=+1; Q branch: branch: =1, J=0.
Spectrum of the Rotating Oscillator P R • The selection rules allow only transitions with D= +1 and J = ±1 (the transition with J = 0 is normally not allowed except those with an odd number of electrons (e.g. NO)).
The IR absorption spectrum can be obtained with gas-phase or with condensed-phase molecules. For gas-phase molecules vibration-rotation spectra are observed, while in condensed phases, the rotational structure is lost. For most routine analytical applications of infrared spectrometry, spectra are obtained with condensed-phase samples. Hence, the discuss here centers around the vibrational transitions observed with molecules present as pure liquid, as solutions, or in the solid state.
Molecular vibrations • How many vibrations are possible (=fundamental vibrations)? A molecule has as many degrees of freedom as the total degree of freedom of its individual atoms. Each atom has three degrees of freedom (corresponding to the Cartesian coordinates), thus in an N-atom molecule there will be 3N degree of freedom. In molecules, movements of the atoms are constrained by interactions through chemical bonds. Translation- the movement of the entire molecule while the positions of the atoms relative to each other remain fixed: 3 degrees of translational freedom. Rotational transitions – interatomic distances remain constant but the entire molecule rotates with respect to three mutually perpendicular axes: 3 rotational freedom (nonlinear), 2 rotational freedom (linear).
Vibrations – relative positions of the atoms change while the average position and orientation of the molecule remain fixed. Fundamental Vibrations
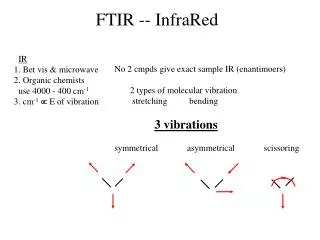
Vibration Types • There are two different types of vibrational modes: Vibrations can either involve a change in bond length (stretching) or bond angle (bending)
The bending vibrations are often subdivided into scissoring, rocking, wagging, and twisting.
Principle of IR experiments • E-vector in electromagnetic radiationhas frequency • Molecular vibrations involving change in dipole moment set up fluctuating electric field • Vibrational energies: fundamental (= one quantum) • Energy transferred to molecule by resonance when vibration frequency is the same as that of the electromagnetic radiation IR SAMPLE SAMPLE* (MOLECULE, GS) (VIB.)
Selection Rules The energy associated with a quantum of light may be transferred to the molecule if work can be performed on the molecule in the form of displacement of charge. Selection rule: A molecule will absorb infrared radiation if the change in vibrational states is associated with a change in the dipole moment () of the molecule. µ= qr q: electrical charge, r: directed distance of that charge from some defined origin of coordinates from the molecule. Dipole moment is greater when electronegativity difference between the atoms in a bond is greater. Some electronegativity values are: H 2.2; C 2.55; N 3.04; O 3.44; F 3.98; P 2.19; S 2.58; Cl 3.16 • Vibrations which do not change the dipole moment are Infrared Inactive (homonuclear diatomics).
Why not 3N-6/3N-5 bands in IR spectrum? • The theoretical number of fundamental vibrations (absorption frequencies) will seldom be observed –> overtones (multiples of a given frequency), combination (sum of two other vibrations) or difference (the difference of two other vibrations) tones increase the number of bands –> the following effects will reduce the number of theoretical bands: • frequencies which fall outside the measured spectral region (400-4000 cm –1 ) • bands which are too weak • bands are too close and coalesce • occurrence of a degenerate band from several absorptions of the same frequency • lack of change in molecular dipole
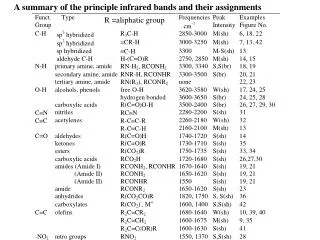
Group frequencies With certain functional or structural groups, it has been found that their vibrational frequencies are nearly independent of the rest of the molecule – group frequencies. Carbonyl group 1650 to 1740 cm-1 various aldehydes and ketones For many groups involving only two atoms, the approximate frequency of the fundamental vibration can be calculated from a simple harmonic oscillator model. Calculations show that for most groups of interest, characteristic frequencies of stretching vibrations should lie in the region 4000 to 1000 cm-1. In practical, the region from 4000 to 1300 cm-1 is often called thegroup frequency region. The presence of various group vibrations in the IR spectrum is of great assistance in identifying the absorbing molecule.
Fingerprint region In the region from 1300 to 400 cm-1, vibrational frequencies are affected by the entire molecule, as the broader ranges for group absorptions in the figure below – fingerprint region. Absorption in this fingerprint region is characteristic of the molecule as a whole. This region finds widespread use for identification purpose by comparison with library spectra.
Coupled Interactions • When two bond oscillators share a common atom, they seldom behave as individual oscillators (unless the individual oscillation frequencies are widely different). The frequency of the asymmetric stretching vibration in CO2 is at a shorter wavelength (higher frequency) than for a carbonyl group in aliphatic ketones (around 1715 cm–1 ). –> there must be strong mechanical coupling or interaction! Example: C–O stretching band in Methanol: 1034 cm –1 Ethanol: 1053 cm –1 not an isolated stretching vibration, but rather a coupled symmetric stretching invloving C–C–O stretching
Requirements for Coupled Interactions • The vibrations must be of the same symmetry • The interaction is greatest, when the coupled groups absorb (individually) near the same frequency --- the same energies of isolated vibrations. • Strong coupling between stretching vibrations requires a common atom between the two groups • Coupling between bending and stretching vibrations can occur if the stretching bond forms one side of the changing angle. • A common bond is required for coupling of bending vibrations. • Coupling is negligible when groups are separated by one or more carbon atoms and the vibrations are mutually perpendicular.
Hydrogen Bonding “A hydrogen bond exists when a hydrogen atom is bonded to two or more other atoms” –> not an ordinary covalent bond, since the hydrogen atom has only one orbital (1s) to engage in covalent bonding Typical H-bond: Hydrogen is attached to two very electronegative atoms, usually in a linear fashion and not symmetrically: X–H••••••B => The s orbital of the proton can effectively overlap with the p or p orbital of the acceptor group.
Effect of Hydrogen Bonding • Hydrogen bonding alters the force constant of both groups: – the X–H stretching bands move to lower frequency – the stretching frequency of the acceptor group (B) is also reduced, but to a lesser degree – The X–H bending vibration usually shifts to a shorter wavelength
IR spectrum y axis is %T or A x axis is wavenumber (or wavelength) Io sample I T = I/Io %T = 100 I/Io T transmission / transmittance A = -log T A absorbance(no units) (Note A (but not T) concentration)
Ordinate Scaling Absorbance spectrum of polystyrene –> generally used for quantitative work Transmittance spectrum of polystyrene –> traditionally used for spectral interpretation
Abscissa Scaling There is a substantial difference in “appearance”, whether the spectrum is linear in wavenumber (A, standard) or linear in wavelength (B): A B (both spectra are recorded with the same sample)
Instrumentation Perkin ElmerTM Spectrum One BRUKE TENSORTM Series
Dispersive instruments: with a monochromator to be used in the mid-IR region for spectral scanning and quantitative analysis. • Fourier transform IR (FTIR) systems: widely applied and quite popular in the far-IR and mid-IR spectrometry. • Nondispersive instruments: use filters for wavelength selection or an infrared-absorbing gas in the detection system for the analysis of gas at specific wavelength.
Dispersive IR spectrophotometers Modern dispersive IR spectrophotometers are invariably double-beam instruments, but many allow single-beam operation via a front-panel switch. Simplified diagram of a double beam infrared spectrometer
Double-beam operation allows a stable 100% T baseline in the spectra. Double-beam operation compensates for atmospheric absorption, for the wavelength dependence of the source spectra radiance, the optical efficiency of the mirrors and grating, and the detector instability, which are serious in the IR region.single-beam instruments not practical.
Dispersive spectrophotometers Designs Null type instrument
Components of dispersive spectrophotometers 1. IR source
Reflection gratings ( made from various plastics): the groove spacing is greater (e.g. 120 grooves mm-1). To reduce the effect of overlapping orders and stray radiation, filters or a preceding prism are usually employed. Two or more gratings are often used with several filters to scan a wide region. • Mirrors but not lenses are used to focus and collimate the IR radiation. Generally made from Pyrex or another material with low coefficient of thermal expansion. Front surfaces coated with a vacuum-deposited thin metal film of Al, Ag, or Au.
Windows are used for sample cells and to permit various compartment to be isolated from the environment. • transparent to IR over the wavelength region • inert to the various chemicals analyzed • capable of being shaped, ground, and polished to the desired optical quality
Fourier Transform Infrared Spectrometer (FTIR) The Fourier transform method provides an alternatives to the use of monochromators based on dispersion. In conversional dispersive spectroscopy, frequencies are separated and only a small portion is detected at any particular instant, while the remainder is discarded. The immediate result is a frequency-domain spectrum. Fourier transform infrared spectroscopy generates time-domain spectra as the immediately available data, in which the intensity is obtained as a function of time. Direct observation of a time-domain spectrum is not immediately useful because it is not possible to deduce, by inspection, frequency-domain spectra from the corresponding time-domain waveform (Fourier transform is thus introduced).
Single-beam FTIR Spectrometer In one arm of the interferometer, the IR source radiation travels through the beam splitter to the fixed mirror back to the beam splitter through the sample and to the detector. In the other arm, the IR source radiation travels to the beam splitter to the movable mirror, back through the beam splitter to the sample and to the detector. The difference in pathlengths of the two beams is the retardation . An He-NE laser is used as a monochromatic reference source. The laser beam is sent through the interferometer in the opposite direction to that of the IR beam.
Interferometer Michelson interferometer If moving mirror moves 1/4 l (1/2 l round-trip) waves are out of phase at beam-splitting mirror - no signal If moving mirror moves 1/2 l (1 l round-trip) waves are in phase at beam-splitting mirror – signal ...