Download
1 / 25
250 likes | 342 Vues
Decadal variations of Sun-like stars (“solar variability after dark”). Wes Lockwood, Lowell Observatory Gregory Henry, TSU. Robotic photometry 1993-2014. 4 telescopes measure 300 Sun-like stars. Lou Boyd, input. Greg Henry, output. Tennessee State Univ. telescopes at Fairborn Observatory.

E N D
Decadal variations of Sun-like stars(“solar variability after dark”) Wes Lockwood, Lowell ObservatoryGregory Henry, TSU
Robotic photometry 1993-2014 4 telescopes measure 300 Sun-like stars Lou Boyd, input Greg Henry, output Tennessee State Univ. telescopes at Fairborn Observatory
18 Sco, the “solar twin” Fairborn observations 2000 – 2013 20124 Range ~0.1%
18 Sco minus star A Range ~0.15% 18 Sco minus star B Range ~0.13% 18 Sco minus rejected star C star A minus rejected star C rejected star C minus star B star B minus star A (selected best comp pair) Range ~0.08%
18 Sco’s Ca II and brightness variation vs. SORCE SIM surprise b mag b y y mag S index b, y, and S are positively correlated in 18 Sco, as we find for most solar age stars... …but SIM suggests b and y should vary differently
Variability of the “solar twins” b (472 nm ) y (571 nm) A few stars have “negative” net variance due to comp. star variability
Could we detect the Sun’s variability? Yes, but only for about 30% of the comparison star pairs Cumulative distribution of comp. star rms measurement noise b y ACRIM data degraded to 18 Sco window and precision
18 Sco brightness - activity variation Solar cycle 23 brighter
Activity-brightness correlation The enlarged sample confirms earlier results Age 122 stars 28 stars
Detection sensitivity S/N of detection falls rapidly for σ < 0.0003 mag rms
Comp. star differential mags b Best pair A and B y
1984-2007: Measuring sunlike stars 1200 nights, 15 years, 6000 data sets, 32 program stars, one (!) observer Lowell 0.5-m telescope night by night year by year Brian Skiff, observer
What we measure Location of Strömgren b & y passbands by
Activity-brightness correlations HK activity brightness variation Age Age Age
Stellar activity & brightness variation HD1835 - a non-cycling star HD10476 – a cycling star Ca II HD 1835 - a non-cycling star HD 1835 - a non-cycling star (b+y)/2 comp. star
A 45 - year perspective HD 1835 - a non-cycling star HD 10476 – a cycling star Ca II (b+y)/2 comp. star
Stellar activity & brightness variation HD1835 - a non-cycling star HD10476 – a cycling star 10% Ca II (b+y)/2 1% comp. star
Stellar activity & brightness variation HD1835 - a non-cycling star HD10476 – a cycling star 10% Ca II (b+y)/2 1% comp. star
Ratio of brightness & activity variation Positive correlation Sun 18 Sco Negative correlation
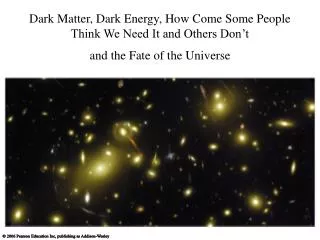
Why this is a tough problem: stellar variability across the HR diagram Here’s the Sun Illustration by M. Grenon