Download
1 / 25
250 likes | 349 Vues
This study explores the relationship between trawling impact and benthic communities in Atlantis polygons, analyzing data on station numbers, species, biomass, and abundance. It investigates the influence of trawling, snow-king crab presence, and temperature on community structure and complexity, identifying key species and indicators of ecosystem health. The study also delves into the resilience and recovery of disturbed communities, examining the impact of large versus small organisms and cumulative species history. Using Vessel Monitoring System (VMS) data, the research presents patterns and consistencies in trawling activities and assesses the effects of fishing on the marine environment. By mapping and analyzing the results, the study aims to provide insights into restoring and preserving marine ecosystems.

E N D
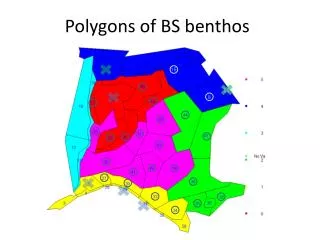
16 Polygons of BS benthos 58 8
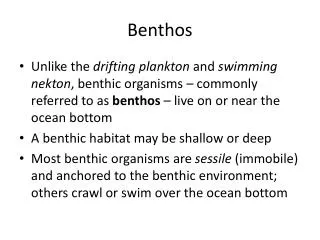
Is the number of communities depended on number of stations in each of the polygons
Is the number of species depended on the number of stations within each polygon ?
Is the mean biomass depended on number of stations within each polygon
Is the mean abundance depended on the number of stations in each polygon
Is the number of species depended on number of communities in each polygon
Does coastal polygons have more communities than bank and open-sea polygons ?
What to do Polygon (within and between comparisons) Species history (within and between species)
Gradients (within and between polygons) • Trawl impact on community structure and complexity • Snow-King crab impact on community structure and complexity • Temperature impact on community structure and complexity
Social-ecological system delivering ecosystem goods and services Disturbed end-member community High stability and low lifespan turnover Low stability and high lifespan turnover Key sp. w. important functions Resilience of an degraded community often makes it difficult for the system to return to its previous, non-degraded state limiting the potential for restoration. Deep-burrowing and bioturbating taxa What's the indicator species Dying out Regime shift Along a gradient or in time Basin of attraction depth ? Basin of attraction depth? Threshold, step-trends, critically rapid transition, tipping point Recovery (engineering resilience)
Teories • Large organisms represent “k-selective” specimens (biomass is important) • Many, small organisms represent “r-selective” specimens (A and B is important) • Cumulative species history represent the “status” (Species number is important) Hypothesis: stations with high degree of trawl impact has low “1”, high “2” and low “3” and visa versa (another history for king/snow crab)
How to present the results ? • Colour polygons according to results • Is there any consistence or pattern ? • Does the species history tell why ? • Temperature “impact” • Impact from invasive top predators • Fishing impact .......
VMS and fishing impact • Vessel Monitoring System • Introduced in Norway in 2000 • All fishing vessels > 15 m (since 2010) • Date, time, vessel, position, speed, heading • Hourly resolution • VMS data = proxy for trawling impact?
Symbolised by vms position counts, ≈ for total no. of hrs trawled