Download
1 / 3
30 likes | 123 Vues
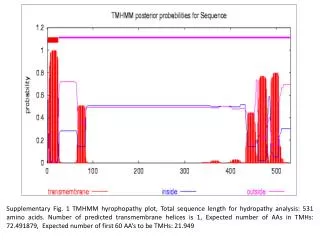
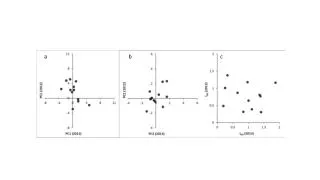
Four supporting figures depict pie charts and graphs showcasing fractions of ESTs based on size, species distribution, and HSP families in Vigna aconitifolia under heat stress. The study reveals insights into gene expression patterns and homology with other plant species.

E N D
Supporting Figure 1: A pie chart showing the ten fractions of ESTs, categorization was based on the size (in bp) of 202 ESTs, identified in the study of heat stress in plant Vignaaconitifolia.
Supporting Figure 2: A graphical representation of the top hit species distribution: The transcripts analyzed show maximum homology to the Glycine max, followed by Populustrichocarpa and Vitisvinifera. No homology was found with V.aconitifolia as very few transcripts available in the databases. Supporting Figure 3: A graphical representation of the species distribution: Species distribution chart of V.aconitifolia after blastX to NCBI nr. No Homology with was found with any Vigna specie.
Supporting Figure 4 : A pie chart showing the fraction of different HSP families represented in heat stress modulated EST clones of V. aconitifolia.