Non-Citizen Population Distribution in U.S. States 2011
10 likes | 106 Vues
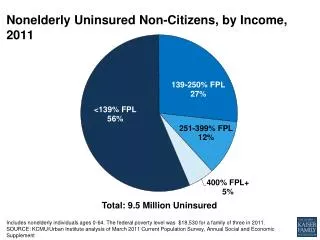
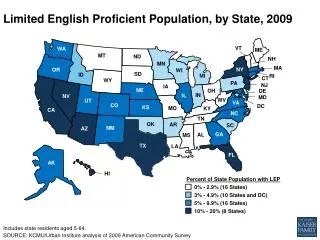
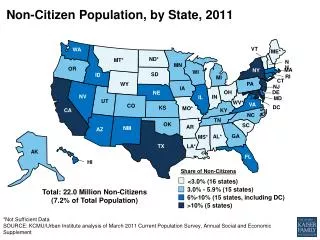
Explore the distribution of the non-citizen population across U.S. states in 2011, categorized by different share percentages. The analysis, based on the March 2011 Current Population Survey, provides insights into non-citizen demographics at a state level, with key findings summarized.

Non-Citizen Population Distribution in U.S. States 2011
E N D
Presentation Transcript
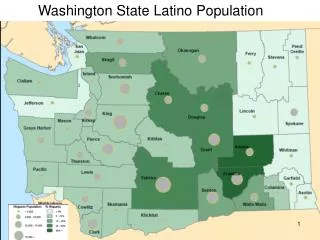
Non-Citizen Population, by State, 2011 VT WA ME* ND* MT* NH MN OR MA NY WI SD ID RI MI CT PA WY NJ IA DE OH NE NV IN IL MD CO UT WV* VA CA DC KS MO* KY NC TN OK SC AZ AR NM GA AL* MS* TX AK LA* FL HI Share of Non-Citizens <3.0% (16 states) 3.0% - 5.9% (15 states) Total: 22.0 Million Non-Citizens (7.2% of Total Population) 6%-10% (15 states, including DC) >10% (5 states) *Not Sufficient Data SOURCE: KCMU/Urban Institute analysis of March 2011 Current Population Survey, Annual Social and Economic Supplement