Download
1 / 71
730 likes | 1.06k Vues
Discover How Metrics Drive Revenue Cycle Performance & Change Behavior. Adding Value to the Revenue Cycle NE Ohio HFMA/Western Reserve AAHAM Revenue Cycle Event February 21, 2013. OhioHealth Revenue Cycle. OhioHealth -Largest healthcare system in Central Ohio

E N D
Discover How Metrics Drive Revenue Cycle Performance & Change Behavior Adding Value to the Revenue CycleNE Ohio HFMA/Western Reserve AAHAM Revenue Cycle Event February 21, 2013
OhioHealth Revenue Cycle OhioHealth -Largest healthcare system in Central Ohio Comprised of five (5) hospitals supported by a consolidated revenue cycle operation: Riverside Methodist Hospital, Grant Medical Center, Doctors Hospital, Dublin Methodist Hospital, Grady Memorial Hospital Revenue Cycle organizational structure includes all of patient access services, health information management and consolidated business office operations Revenue Cycle part of the finance division vertical Revenue Cycle is responsible for collections of approx $2B annually
OhioHealth Revenue Cycle Revenue Cycle Awards: 2010 HFMA MAP Award Winner 2012 HFMA MAP Award Winner 2012 HBI Revenue Cycle Award Winner
OhioHealth Revenue Cycle FY12 Revenue Cycle KPIs:
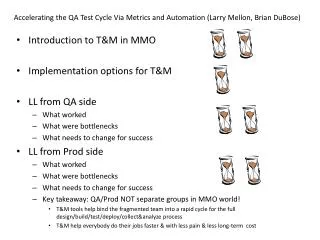
Key Objectives • Integrating KPIs into Performance Improvement for the Revenue Cycle • Creating an environment for process improvement • Using resources to support process improvement • Celebrating success in the revenue cycle • Case Study: OhioHealth Denial Reduction Initiative
Level I KPIs-Overall Revenue Cycle Performance Overall Revenue Cycle-Monthly and Year to Date Reporting • Cash by major payer category daily and month-end • Cash to Net % • Discharged not final billed – Days in A/R (include failed claims) • Accounts receivable aging • Self pay AR (include % of total AR) • Gross AR days and Net AR days • Bad debt write-offs as % of GPR • Charity write-offs as % of GPR • Denial write-offs as % of GPR • Denial AR • Payment Variance AR
Level II KPIs-Departmental Performance Patient Access Services (PAS) – Monthly Scorecard • Point of Service collections • Press Ganey (customer service) Inpatient and Outpatient • Registration Error Rate (%) • Pre-registration of scheduled procedures (%) • Central Scheduling - % of calls answered < 10 seconds • Central Scheduling - % of calls answered > 40 seconds
Level II KPIs– Departmental Performance Health Information Management (HIM) – Monthly scorecard • $ delayed in HIM • Failed Bill accounts > 6 days • Combined DNFB days (including failed claims) • Transcription turnaround time • Clinical chart turnaround time • RAC Data
Level II KPIs-Departments Performance Central Business Office (CBO) – Monthly Scorecard(s) • AR > 90 days by Payer • Credit Balances in GPR Days • Clean Claim Rate • Initial Denials by category and payer $ and % of GPR • Final Denials by category and payer $ and % of GPR • Patient cash $ and % GPR • Bad debt and charity write-offs and % GPR • Call center abandonment rate % • Charity application inventory • Medicaid conversion rates • Patient complaint logs • Return mail rates
Level III KPIs –Associate Performance • PAS - individual productivity and quality scores; POS collections per associate • HIM – coding quality and productivity; imaging quality and productivity • CBO – individual agings; payer collections; productivity and quality monitoring • CBO Customer Call Center – telephony statistics including abandonment rates, hold times, collections
Level III KPIs-Business Partner Scorecard Business Partner– Monthly Scorecard(s): • Payers • Bad Debt Agencies • Medicaid Eligibility Vendor • Estate Vendor • Motor Vehicle Vendor • Transcription Vendor • Denial Vendor
Environment to Support Process Improvement Organizational Structure: • Patient Access/HIM/Consolidated Business Office report to Revenue Cycle Vice President • Revenue Cycle reports to CFO • Revenue cycle leadership and management team – on the same train! • Key result: Common goals, targets and initiatives
Environment to Support Process Improvement Communications: • Revenue cycle leaders meet monthly with facility CFOs, controllers, net revenue team to review key indicators, identify opportunities for improvement and develop and report action plans • Key result: Critical conversations around performance, opportunities and action plans among all leaders to (1) understanding of issues (2) action plans (3) monitoring of progress (4) issue resolution
Resources to Support Process Improvement Resources: • Develop a team of fulltime analysts (system and financial) who can extract data from the HIS and other critical systems, create data bases to manipulate data, and develop standardized reporting and comparative analyses (Don’t rely solely on an AR manager to create reports - they won’t have time to manage their operation!) • Select ancillary systems such as AR workflow, registration QA, imaging workflow, etc. which provides easy to use analytical tools to create reports and comparative analysis; review the reports • Hold all managers and staff accountable for success! Build goals and targets into the management performance appraisal
Process Improvement HFMA MAP Strategy M Measure A Apply P Perform MAP stands for measure performance, applyevidence-based strategies for improvement, perform to the highest standards in today’s challenging healthcare environment.
Process Improvement Measure: • Establish internal KPIs - know where you are • Research literature (HFMA/HARA/MAP) for current benchmarks • Utilize not only benchmarking but internal trend data to identify and document ongoing improvements
Process Improvement Apply: • Review data results • Identify opportunities • Develop targets and goals • Make it a “stretch” goal but achievable
Process Improvement Perform: • Develop action teams (combination of finance, revenue cycle and clinical and departmental representation) • Identify processes contributing to obstacles • Collaborate on solutions • Measure performance at least monthly against benchmarks • Hold teams accountable • “Make it happen!”
Celebrate your Successes Recognition of all successes along the way! • “Thank you” notes • Recognition in newsletter(s) – photos/articles • Recognition in meetings • Hand-written notes w/ thank you • Contests/prizes/gift cards • “Right Choice Awards” • Management bonuses based upon goal achievement
OhioHealth Case Study Denial Reduction
HFMA “MAP” Strategy on Denials • Defining and identifying payer denials (Measure) • Reducing payer denials (Apply) • Achieving process improvement (Perform) MAP = Results
Definitions • What is a payer denial or delay? • Payment was expected by the service provider but was not received from the payer. Additional action must be taken by the provider in order to receive payment from payer. Additional action does not always guarantee payment. • Initial Denial: • Pre-action initial denial • Final Denial: • Post action final write-off i.e. claim has been appealed and denial upheld by payer • Payer Delay: • Request for information before payment can be received from payer
Denial Examples Payer Denials: • No authorization • No notification • No pre-cert • Not Medically Necessary • Pre-Existing Condition • Experimental • Non-Covered • General technical billing errors i.e. Incorrect Subscriber ID, missing info on UB format, etc… • Timely Filing • Benefits Exhausted • Out of Network
Delay Examples Payer Delays: • Medical record request • Itemized statement request • Coordination of benefit to determine primary payer vs secondary payer
Identify • Critical step towards resolution • Quantification of data tells story and changes behavior; first step is to identify and then quantify • Very complicated but can be achieved • Manual identification • Electronic identification
Manual Identification • Posting from paper remittance advice/explanation of benefits (EOB) • Identification through follow-up process • Inefficient and ineffective • Opportunity for error
Electronic Identification HIPAA: • The Health Insurance Portability and Accountability Act (HIPAA) was passed on August 21, 1996. Among other things, it included rules covering administrative simplification, including making healthcare delivery more efficient. Portability of medical coverage for pre-existing conditions was a key provision of the act as was defining the underwriting process for group medical coverage. It also provided standardization of electronic transmittal of billing and claims information. • The final version of the HIPAA Privacy regulations were issued in December 2000, and went into effect on April 14, 2001. A two-year "grace" period was included; enforcement of the HIPAA Privacy Rules began on April 14, 2003. The April 14, 2003 deadline is when the penalties can be applied for non-compliance. Note: • Administrative Simplification :) • Standardization has taken too long and still has a long way to go!
ANSI 835 • HIPAA proposed, in part, to standardize and privatize the electronic exchange of information between providers and payers. • ANSI 835 is the American National Standards Institutes (ANSI) Health Care Claims Payment and Remittances Advice Format. This format outlines the first all electronic standard for health care claims. The format handles health care claims in a way that follows HIPAA regulations. Prior to the creation and implementation of 835, there were hundreds of different electronic remittance formats in use. HIPAA requires the use of 835 or an equivalent. • ANSI, ANSI, ANSI…… Linking ANSI Standards to Denial Management
Claim Adjustment Reason Codes (CARC) • X12 N 835 Health Care Claim Adjustment Reason Codes: • A national code maintenance committee maintains the health care Claim Adjustment Reason Codes (CARCs). • Over 200 Current Codes • The Committee meets at the beginning of each X12 trimester meeting (January/February, June and September/October) and makes decisions about additions, modifications, and retirement of existing reason codes. • The updated list is posted 3 times a year around early November, March, and July. • The list is available at http://www.wpc-edi.com/codes
Remittance Advice Remark Code(RARC) • X12N 835 Health Care Remittance Advice Remark Codes: • The Centers for Medicare & Medicaid Services (CMS) is the national maintainer of the remittance advice remark code list. • Over 800 Current Codes • Under HIPAA, all payers, including Medicare, are required to use reason and remark codes approved by X12 recognized code set maintainers instead of proprietary codes to explain any adjustment in the claim payment. • CMS, as the X12 recognized maintainer of RARCs, receives requests from Medicare and non-Medicare payers for new codes and modification/deactivation of existing codes. • Additions, deletions, and modifications to the code list resulting from non-Medicare requests may or may not impact Medicare.
Health Information System CARC/CAG Mapping Table • Develop team to review and map CARC and Claim Adjustment Groups • Team to include members from payer follow-up, remittance posting, and IT • Update Health Information System mapping table • Continue to monitor as payers change codes • Future changes-Stakeholder signoff both payer follow-up and remittance posting leadership • Some payers use codes differently therefore create master table and then subset for unique payer usage • Keep in close communication with payer EDI department/contacts for changes or updates to codes
Initial Denial Identification • Categorize initial denials and develop work flow for resolution • Example: “CO-197 NPRE Lack of Precert/Auth” – route to clinical appeal team for action • Develop separate Financial Class for pending appeals and monitor i.e. medical necessity and precert/auth denials