Download
1 / 34
350 likes | 459 Vues
This research delves into the fluorescence properties of biomolecules, exploring spectroscopic behaviors and molecular movements in different environments. The study examines solvent relaxation, Forster resonance energy transfer efficiencies, fluorescence depolarization, and rotational motions, shedding light on complex interactions within biomolecular systems. Various spectroscopic techniques are utilized to analyze the dynamic behavior of biomolecules, providing valuable insights into their structure and function.

E N D
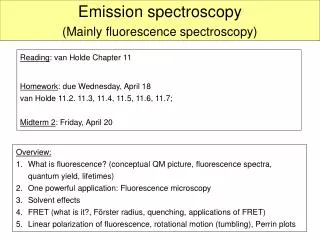
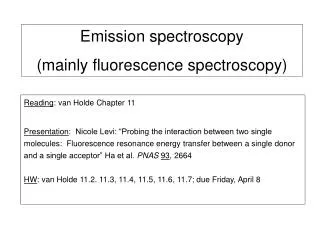
Emission Spectroscopy and Molecular Motions in Biomolecular Systems. W.C. Galley, Dept. of Chemistry
Base Acid Base Neutral Neutral Acid
Fluorescence Spectrum of ANS in Differing Local Environments. F x30 450 500 550 wave.length (nm)
Fluorescence Spectrum of ANS in Differing Local Environments. F glycerol/H2O at 296K x30 450 500 550 wave.length (nm)
Fluorescence Spectrum of ANS in Differing Local Environments. glycerol-H2O at 77K (rigid glass) F glycerol/H2O at 296K x30 450 500 550 wave.length (nm)
The fluoresence of pyrene displaying the presence of both the monomer fluorescence as well as an excimer band. The latter arises from the formation of a complex between a molecule in the excited singlet state and a monomer.
The contribution of the “excimer” to the monomer band in the fluorescence of pyrene in e.g. a membrane is dependent on the ability of the probe to diffuse during the long pyrene excited singlet-state lifetime of ~ 200 nsec. (t for Trp ~ 4 nsec)
Pyrene forms excited- and ground-state dimers (excimers). The excimer displays its own red-shifted fluorescence. • b) Pyrene has an exceeding long excited-singlet state (“fluorescence”) lifetime. It has the opportunity to diffuse and encounter partners. • c) The data provide a measure of viscosity of the media e.g. lipid bilayer.
The Measurement of Forster (FRET) Transfer Efficiencies from Donor Quenching. In the presence of a single donor and acceptor: fluorescence intensity of the donor in the presence of acceptor. fluorescence intensity of the donor alone.
A protein with 2 potential Trp donors and a coenzme acceptor “A” ? ?
Fdonor Fdonor + coenzyme
Decomposition of the Trp decay in the presence of coenzyme into a bi-exponential decay Time (nsec)
Fluorescence Depolarization and Rotational Motions. F║ F┴ ║ ┴ ║ ┴
chromophores with their transition dipoles randomly distributed chromophores photo-selected with transition dipoles in the vertical direction. F║ F┴ F┴ > F║
Steady-state emission anisotropy A can be represented in the form of the Perrin Equation: where Ao = the anisotropy anticipated for a rigid particle. = 0.4 when the absorption and emission transition . dipoles are in the same direction (parallel). = - 0.2 when the transition dipoles are perpendicular and tF = the lifetime of the excited state. Note: when A = 0.5Ao, f = tF
f = the rotational correlation time. It is a measure of the time t it takes for the molecule to forget where it was, in a rotational sense, at t = 0. From an Equation due to Einstein f for a spherical particle is given by: V is the volume of the particle, h = the viscosity of the solvent in which it is swimming. For a spherical particle A(t) decays exponentially:
Inverting the equation results in a form that is linear in 1/f: or So that a plot of 1/A versus T/hresults in a linear equation .if there is a single rotational correlation time. The plot is generated by measuring A while varying h and/or T. The solvent viscosity can be varied by adding sucrose or e.g. glycerol to a buffer. tF must be known and Ao can be obtained from the intercept.
Decay of the vertically- and horizontally-polarized components of the fluorescence of a labelled globular protein. vertically-polarized excitation
The exponential decay indicates a single rotational correlation time fcharacteristic of isotropic rotations. With a rigidly-bound label the rotational correlation time reflects the overal rotation of the globular protein as a hydrated sphere:. A non-sperical object displays a non-exponental decay that might contain as many as 5 components, with a rod-like particle possessing 3 rotational correlation times.