Download
1 / 16
160 likes | 267 Vues
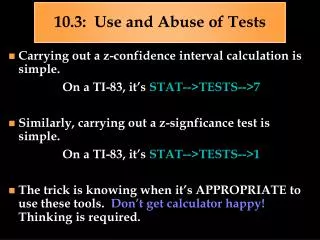
10.3: Use and Abuse of Tests. Carrying out a z-confidence interval calculation is simple. On a TI-83, it’s STAT-->TESTS-->7 Similarly, carrying out a z-signficance test is simple. On a TI-83, it’s STAT-->TESTS-->1

E N D
10.3: Use and Abuse of Tests • Carrying out a z-confidence interval calculation is simple. On a TI-83, it’s STAT-->TESTS-->7 • Similarly, carrying out a z-signficance test is simple. On a TI-83, it’s STAT-->TESTS-->1 • The trick is knowing when it’s APPROPRIATE to use these tools. Don’t get calculator happy! Thinking is required.
Choosing a Level of Significance • Recall that the P-value gives you the strength of the evidence against the null hypothesis. • We often decide whether or not to reject the null hypothesis based on the chosen significance level, a. • However, a should not be treated as some sort of universal standard. Different situations require difference significance levels.
Choosing a Level of Significance • The significance levels of 1%, 5%, 10% come from a time before the help of computers or software. They were born from convenience, not scientific rigor. • Because of this, no matter what the signifiance level is, YOUSHOULD ALWAYS REPORT THE P-value!!!
Choosing a Level of Significance • Another thing to consider: There is NEVER an exact cut-off between significant and insignificant, only increasing evidence against the null hypothesis as the P-value decreases. • For example, there is no practical difference between P-values of 0.049 and 0.051, even though the first is significant at the 5% level and the second, technically, is not. • You have to use your discretion!
What statistical significance doesn’t mean • Suppose we perform a significance test and determine significance. (P-value ≤ a). • This means: there is good evidence that an effect is present. • This DOES NOT mean: there is good evidence that the effect is large.
What statistical significance doesn’t mean • Given a large enough sample, even small deviations from the mean will yield significance. • For example, if n = 1000, a correlation of r = 0.08 is significant at the 1% level given a null hypothesis of r = 0. • But r = 0.08 is an extremely small correlation! • So what we’ve shown is: There DOES appear to be a positive association. • What we HAVEN’T shown is: The association is large.
What statistical significance doesn’t mean • Q: So what do we do? • A: PLOT YOUR DATA! Look for outliers, influentials, or any systematic deviations (bias). • A significance test is a cool thing, but it’s overused. While a significance level says NOTHING about the size of an effect, a Confidence Interval DOES help you determine the size of an effect. IT NEVER HURTS TO USE BOTH!
Proper Steps of Data Analysis • Use graphical analysis - NQPs, Boxplots, and Histograms. • Use significance tests to determine if there is an effect. • Use confidence intervalsto determine the size of the effect.
Don’t ignore lack of significance • It is easy to get obsessed with trying to show that an effect exists. • Upon discovering there isn’t one, many researchers have discarded their work. • But keep in mind: not finding an effect where we expected to see one is important too! Moral: ALWAYS REPORT YOUR RESULTS • For one, you don’t want to doom others to doing your experiment. • For another, it is worthwhile to analyze WHY no effect was detected.
Statistical Inference is not valid for all data sets • Remember, badly designed experiments produce worthless results. Even math can’t save the day. • Remember also that we sometimes don’t always know WHAT caused a result, even in a seemingly well-designed experiment. • This raises the issues of confounding and lurking variables.
Statistical Inference is not valid for all data sets • For example, there exists statisticalsignificance between the English vocabulary scores of high school seniors who have studied a foreign language and those who have not. • Does this mean taking a foreign language cause higher English vocabulary scores? Or does it mean that taking a foreign language is confounded by the type of student who takes a foreign language during their senior year? Statistical significance tells us a difference exists, but it doesn’t tell us HOW or WHY the difference exists.
Beware of searching for significance Statistical Significance has its basis in probability. But even randomness can show a pattern if you look long enough. This can lead to problems if you perform too many tests on the same data.
Beware of searching for significance • Example: There was a team of psychiatrists who performed SEVENTY-SEVEN significance tests on a set of data that contained 77 variables! • Consider this, if you made 77 tests at the 5% level, you would expect a few to be significant by pure chance. After all, results significant at the 5% level happen 5 out of 100 times (in the long run) EVEN WHEN THE NULL HYPOTHESIS IS TRUE! • So it wasn’t really meaningful when the psychiatrists achieved significance for two of the tests.
Morals of the Story • A significance level should be used as a guideline, not a rigid barrier. • Significance levels should vary based on the severity of the experiment.
Morals of the Story • Significance tests DO NOT tell you whether an effect is large or small. They only tell you whether an effect exists. • Use Confidence Intervals to determine the size of an effect.
Morals of the Story • Don’t ignore lack of significance. Sometimes you learn more from failing than you do from succeeding! • Beware of confounding and lurking variables before drawing any conclusions from a significance test. • Searching for significance should NOT be the goal. It is simply a tool which can yield helpful information for a properly designed experiment.