Download
1 / 37
370 likes | 560 Vues
Piedmont Triad Market Trends, Preferences and Opportunities to 2040 . PRESENTATION TO PIEDMONT TRIAD LIVABLE COMMUNITIES SUMMIT Arthur C. Nelson October 25, 2012. PARTNERS. Outline. Broad National Trends Piedmont Triad Trends Population, Minority and Senior

E N D
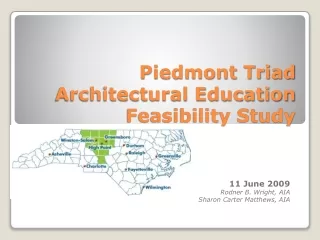
Piedmont Triad Market Trends, Preferences and Opportunities to 2040 PRESENTATION TO PIEDMONT TRIAD LIVABLE COMMUNITIES SUMMIT Arthur C. Nelson October 25, 2012
Outline • Broad National Trends • Piedmont Triad Trends • Population, Minority and Senior • Demand by Household Type and Age • Ownership Rates • Development Estimates • Piedmont Triad Preferences • Piedmont Triad Opportunities
Drivers of Change • Demographic • Aging + Minority Growth • Economic • Stagnating incomes &employment • Financial • Tighter money for home loans • Preference • More amenities, more options, better accessibility
Household Size Has Stabilized Source: Census.
Multi-Generational Households May Keep HH Sizes from Falling Further Source: Census Current Population Reports; Pew.
What a Difference a Generation Makes 1990-2010 2010-2030 0% 83% 17% 10% 16% 74%
U.S. Starter, Mature, Downsizing Household Trends, 1990-2010 Note: Figures in thousands. Source: Arthur C. Nelson, Metropolitan Research Center, University of Utah.
U.S. Starter, Mature, Downsizing Household Trends, 2010-2030 Note: Figures in thousands. Source: Arthur C. Nelson, Metropolitan Research Center, University of Utah.
U.S. Share of HH Change by Race & Ethnicity, 2010-2030 Note: Figures in thousands. NH means non-Hispanic. Source: Arthur C. Nelson, Metropolitan Research Center, University of Utah, using data from Woods & Poole Economics (2012).
Home Ownership Rates2010 & 2030 Notes: Owner rates in 2030 by ethnicity in 2010 held constant to 2030 accounting for change in ethnic profile. Owner rates in 2030 @ 95% assumes underwriting comparable to 1980s and reduced role of GSEs. Source: Arthur C. Nelson, Metropolitan Research Center, University of Utah.
Rental Share of Housing Growth 2010-2030 • Source: Arthur C. Nelson, Presidential Professor & Director, Metropolitan Research Center, University of Utah.
Number of Seniors 1970-2040 Source: Arthur C. Nelson, Metropolitan Research Center, University of Utah
Buy-Sell Rates by 5-Year Age Cohort Source: Dowell Myers & Sung Ho Ryu, “Aging Baby Boomers and the Generational Housing Bubble: Foresight and Mitigation of an Epic Transition”, Journal of the American Planning Association 74(1): 1-17 (2007).
Relocation Choices of Seniors Housing Type Before Move After Move Apartment20% 59% Source: Arthur C. Nelsonbased on analysis of American Housing Survey 2005, 2007, 2009. New movers means moved in past five years. Annual senior movers are about 3% of all senior households; 60%+ of all seniors will change housing type between ages 65 and 85.
New Housing Market Realities • Sub-prime mortgages are history. • 20% down-payments are the new normal. • Fannie Mae & Freddie Mac on chopping block. • Meaning • Smaller homes maybe more people per unit • Smaller lots more attached units • More renters including doubled-up renters
From 1998 to 2012, the national average price of a gallon of gasoline rose more than 8% per year, compounded.[1] At this rate, gasoline prices will approach $8 per gallon by 2020 and $15 per gallon by 2030 Gasoline Price Trends 2002-2012 • 2002-2012 gasoline prices rose at 10%+ per year, compounded. At this rate gasoline prices will be • $8/gallon by 2020 • $15/gallon by 2030 • Source: Adapted fromEnergy Information Administration (2012). http://www.eia.gov/dnav/pet/hist/LeafHandler.ashx?n=PET&s=EMM_EPM0_PTE_NUS_DPG&f=W R2 = 0.70; t-ratio = 35.86; p > 0.01.
Population 2010-2040 Source: Arthur C. Nelson
Population 65+ 2010-2040 Source: Arthur C. Nelson
Households by Type 2010-2040 Source: Arthur C. Nelson
Householders by Age 2010-2040 Source: Arthur C. Nelson
Tenure Change 2010-2040 *Assumes underwriting prevalent in 2000s excluding sub-prime & alt-A mortgages. Source: Metropolitan Research Center, University of Utah
Housing Development 2010-2040 Source: Arthur C. Nelson
Selected Southeastern States: Support for and Willingness to Live in Mixed use, Walkable Communities Note: States include North Carolina, South Carolina, Georgia, Kentucky and Tennessee. Source: Porter-Novelli (2003; 2005)
Selected Southeastern States: How Personally Important Is It to Be Able To Walk or Bike to Work and for Shopping? • Note: States include North Carolina, South Carolina, Georgia, Kentucky and Tennessee. • Source: Porter-Novelli (2003; 2005)
U.S. Percent Walking or Biking to Work, Shopping or Other Errands, 1995-2009 • Source: National Household Transportation Survey 2009 (2011)
Community Preference Tradeoff Note: States include North Carolina, South Carolina, Georgia, Kentucky and Tennessee. Source: Adapted from NAR (2011).
Trading Off Housing Attributes Note: States include North Carolina, South Carolina, Georgia, Kentucky and Tennessee. Source: National Association of Realtors.
Tear Up a Parking Lot,Rebuild Paradise Large, flat and well drained Single, profit-motivated ownership Major infrastructure in place 4+ lane highway frontage “transit-ready” Committed to commercial/mixed use Can turn NIMBYs into YIMBYs Slide title phrase adapted from Joni Mitchell, Big Yellow Taxi, refrain: “Pave over paradise, put up a parking lot.”
Life-Span of Building Function Life-Span of Building Function Source: Arthur C. Nelson, Presidential Professor & Director of Metropolitan Research, University of Utah, based on DoE Commercial Buildings Energy Consumption Survey.
Nonresidential Development 2010-2040 Source: Arthur C. Nelson
Review • The market is changing faster than we may manage. • Demand for rental homes and probably smaller homes on smaller lots may dominate the market to 2040. • 25%-33% want walkable, mixed-use communities with transit options but <10% have those options now. • Even if all new housing provided these options to 2040 by then demand may still not be met.