EPANET FOR PRESSURIZED PIPE SYSTEMS
EPANET FOR PRESSURIZED PIPE SYSTEMS. WHAT IS IT?.

EPANET FOR PRESSURIZED PIPE SYSTEMS
E N D
Presentation Transcript
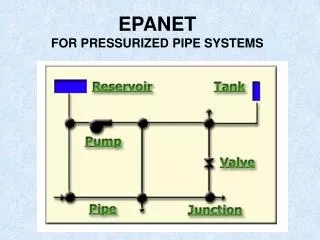
WHAT IS IT? “EPANET is a Windows computer program that performs extended period simulation of hydraulic and water-quality behavior within pressurized pipe networks. A network can consist of pipes, nodes (pipe junctions), pumps, valves and storage tanks or reservoirs.”
WHO DEVELOPED IT? Water Supply & Water Resources Section of the Environmental Protection Agency (Lewis Rossman)
WHERE CAN I GET IT? EPANET AND MANUAL CAN BE DOWNLOADED AT http://servicecenter.kcc.usda.gov/sfw_e_l.htm
ADVANTAGES OF USING EPANET: • SURVEY DATA CAN BE READ INTO PROGRAM (A LITTLE EDITING IN EXCEL) • ALL CALCULATIONS ARE DONE INTERNALLY AND QUICKLY • GRAPHICS, SUMMARY OUTPUT TABLES • EASY TO CHECK OTHER PERSONS WORK • CHANGES ARE QUICK AND EASY • UNLIMITED NETWORK SIZE AND COMPLEXITY (LOOPED SYSTEMS, ETC.) • ERROR CHECKING AND WARNINGS • DISADVANTAGES OF USING EPANET: • HAVING TO LEARN THE PROGRAM (CAN TAKE SOME TIME). IT HAS USDA CCE CERTIFICATION
Program components • Lets check out the various components with a simple example. • A gravity pipe running from a diversion to a pond
EXAMPLE PUMPED SYSTEM PROBLEM We are installing a pump in a stream to pump water to an on-farm irrigation system. After analyzing the on farm system, we have determined that the peak crop water requirement is 350 gpm and the pressure requirement at the turnout is 60 psi. The location of the pump and pipeline have already been surveyed. PVC pipe will be used. Pump site elevation = 3500 ft • Determine the: • Pump selection to deliver the flow and pressure to the turnout • Pressure rating of the pipe • Daily electrical costs to run the pump
From Berkeley Pump Selection Software, Q = 350 gpm, TDH = 215 ft Power, hydraulic (water) : 18.97 hp Power, brake : 26.90 hp Minimum recommended driver rating set @ : 30.00 hp / 22.37 kW
Electronic Variable Frequency Drives (VFD’s) “control the speed and torque of an AC electric motor by varying the frequency and voltage of the electricity supplied to the motor. They replace inefficient, energy robbing controls such as control valves, pressure reducing valves, etc.”
Why Use VFD’s? From Pump Affinity Laws (constant impeller diameter): P1/P2= (N1/N2)3 P = Power N= Speed (rpm) Initially we have a 10 hp pump running at 3600 rpm to meet demand and pressure requirements in our piping system. Demand declines and the VFD lowers the pump speed to 3200 rpm. What are the power savings? P1 = 10 hp N1 = 3600 rpm N2 = 3200 rpm P2 = 7 hp An 11.1% speed decrease results in a 30% decrease in power Consumption! Small speed decreases result in large energy savings.
The Real Cost of Electricity-Whats On Your Bill! Example Bill **Demand Charge is based on the highest average 15 minute power usage for the billing period. Demand charge kicks in at > 15 kw usage. (pacific power)
Summary of Pipeline/Irrigation Projects Using GIS Survey--EPANET 1) Conduct the GPS survey of water levels, pumps, pipelines, sprinkler locations, etc. 2) Export the data from Survey Pro to a text format. 3) Read the exported text file into Excel and manipulate it into The EPANET input format. 4) Import the nodes into EPANET 5) Draw the pipe network and begin the simulation
Emitter-Sprinkler Orifice Equation q = C py q = emitter flow rate C = discharge coefficient p = pressure y = pressure exponent y = 0.5 for sprinklers/nozzles
Calculate the Emitter Coeficients for the Varying Nozzles For the rainbird 30H (SBN-3) with plug @ 50 psi: 9/64” nozzle, C = q/p0.5 = 4.1 gpm/ 500.5 = 0.580 5/32” nozzle, C = 0.707 11/64” nozzle, C = 0.863 3/16” nozzle, C = 1.018 Change the emitter coefficient in EPANET to change the Sprinkler/nozzle.