Download
1 / 7
80 likes | 194 Vues
This project presentation explores the significant drop in high school math Standards of Learning (SOL) test scores in Virginia from 2011 to 2012. The research focuses on T.C. Williams High School and West Potomac High School, comparing pre- and post-2012 testing data. Various hypotheses regarding the decline are examined, including the rigor of new SOLs and test formats, and the transition to computer-adaptive testing (CAT). Key observations inform recommendations for improved clarity and process oversight by the Virginia Department of Education (VDOE).

E N D
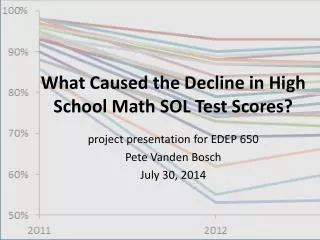
What Caused the Decline in High School Math SOL Test Scores? project presentation for EDEP 650 Pete Vanden Bosch July 30, 2014
Project History • 12 July plan: Examine T. C. Williams HS math testing • 18 July plan: Examine West Potomac HS math testing • 21 July plan: Examine statewide math testing by individual SOL
Research Question What were the causes of the statewide drop in high school math SOL test scores from 2011 to 2012? Hypotheses: • A: The new SOLs were more rigorous • B: The new tests were more rigorous • Independent of any change in rigor in the SOLs. • C: Students and teachers had “learned” the old test format and approach. • D: The shift to electronic format (CAT) • E: Chance
Highly Consistent Pattern A: SOL rigor B: Test rigor C: Test learning D: CAT E: Chance
Main Data Collection/Analysis Scheme SOL competencies pre-2012 Test questions pre-2012 Test questions post-2012 SOL competencies post-2012
Analysis Results A: SOL rigor B: Test rigor C: Test learning D: CAT E: Chance • Observations: • More added than removed in Algebra I & II • More removed than added in Geometry • Can account for AT MOST: • Algebra I: 12% of the 19% drop • Geometry: 0% of the 13% drop • Algebra II: 8% of the 22% drop
RecommendationsAssuming my preliminary research holds up • VDOE clarity is needed: • Yes, some of the SOL competencies changed… • …but for those unchanged, did the tests get harder? • VDOE start connecting individual competencies to each test question • improves analysis of validity, reliability • educators might actually be able to use the results • Oversight of VDOE testing process and results