Download
1 / 19
190 likes | 271 Vues
Discover how digital images are composed of pixels, and how remote sensing techniques gather data without direct contact. Learn about multi-spectral remote sensing, contrast and brightness levels, histograms, density slicing, particle analysis, density calibration, and Digital Elevation Models.

E N D
Applying Pixel Values to Digital Images Lumberton High Sci Vis II V202.02
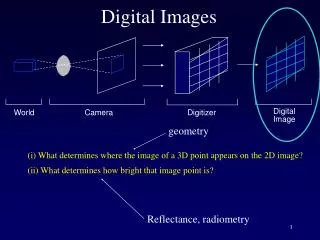
Digital Images Gather Data by Remote Sensing • Remote Sensing is the process of gathering information without touching it. • Satellites use a number of different sensors (IR, UV, Visible light, Radio) to record information
Digital Images Gather Data by Remote Sensing • Example of remote sensing include: • The Human eye gathering light. • Bats sensing their environment by emitting sound waves and listening for the reflected echo. • Rattlesnakes detecting heat radiation of small animals • Sounds waves used in medical Imaging (MRI) • X-rays used to detect to detect broken bone
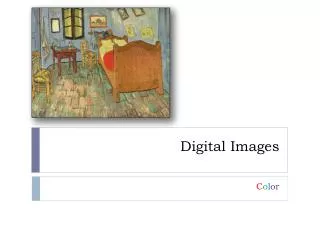
What are Digital Images? • Digital images are composed of pixels arranged in rows and columns. • Each pixel carries a numerical values or digital number (DN). • Colors or shade of gray (brightness) are assigned to each DN.
What are Digital Images? • A LUT (Look-Up table) is used to show the scale relationship between each pixel’s DN and its assigned color or gray brightness value. • Changing the LUT scale controls the appearance of the image.
What are Digital Images? • To digitize a photo, we superimpose a grid over the image and use the intersection of a row with a column to locate objects (similar to longitude and latitude). • The brightness value at each X and Y location can be recorded by the satellite scanner (detector). The brightness value or DN is the Z-value associated with a picture element or pixel. • By reducing the size or spacing of the grid, we can digitize at a finer and finer spatial resolutions.
What are Digital Images? • Digital data can be manipulated • Colors can be assigned to an image using the LUT (Pseudo-color images). This process to visualize specific DN values. Use colors include. • Making clouds visible in weather maps • Coloring malignant cells a bright color to stand out in an image • Separating important data from the rest of the image • Separating colder blue areas and warmer red areas in a weather map
Multi-spectral Remote Sensing • Recording energy in the red, green, blue, IR, UV, or other parts of the electromagnetic spectrum. • Collected data can be qualitative or quantitative. • TIR (Thermal Infrared) sensing exploits the fact that everything above absolute zero (0 K, -273 C, -459 F) emits radiation in the infrared range. For example, infrared weather satellite can sense temperature.
Multi-spectral Remote Sensing • Multi-spectral remote sensing measures the amount of energy reflected in discrete bands that correspond to specific colors. • Scientists can obtain information from these wavelengths (color). • For example, scientists can pick out the range of color of marijuana plants grown in North Carolina.
Contrast and Brightness Levels • The BRIGHTNESS is the intensity of white in an image. • The CONTRAST is the difference between the lightness and darkness of an image.
Histograms in Area Renderings • Histograms are displayed as a bar graph with each shade of gray represented by one of the vertical lines. The height of the bar displays the number of pixels. • By mathematical stretching the range of pixels, features can be seen which are not apparent. Areas such as rivers streams, and lakes are enhanced and are more easily viewable.
Measuring in Area Renderings • The portion of the earth is dependent on the height of the satellite. Most weather satellites use the scale of 16 square miles equals 1 pixel. Programs like Scion Image allow you to set these scales. • The curve of the earth may add variation to these renderings.
Density Slicing • Density slicing allows you to highlight a range of pixel values in the LUT. • The highlighted pixels help visualize areas of interest. • Density slicing is part of “particle analysis” where you let the computer locate an area of interest (a lake for example) and then the computer will analyze the slice (area, height, temperature, etc.)
Particle Analysis • Particle analysis allows one to highlight specific pixel values and take measurements (i.e. calculating the area and perimeter of a massive cloud or the size of a tumor). • Combining Set Scale, Density Slicing, and Particle Analysis is very useful to isolate and measure specific parts of a digital image.
Density Calibration • Density calibrating an image will mathematically relate the values of one pixel to other pixels. • If you know the elevation of a particular mountain, you can select those pixels and set the scale. The relative elevation of the other areas can then be estimated. • Density calibration is based on making predictions from a line graph (linear regression).
Digital Elevation Models (DEM’s) • DEM’s are images where DN (digital number) or grayscale values represent elevation. • A digital image can be converted into a relief map. • In Scion Image, we use Surface Plot to produce a relief map.
Elevation Calibration (Calibrated DEM’s) • Take the data from a DEM to apply known elevation to calculate other elevations. • Mapping out the sea surface floor is an example of using this method.
Animation • Multiple images of an area can be opened at the same time. (Images of a hurricane taken every hour). • Images are put into a “stack” which works very much like a “flip book”. Useful for showing the movements of storm patterns.