AFNI
AFNI. Robert W Cox, PhD National Institute of Mental Health Bethesda, MD http:// afni.nimh.nih.gov/afni. An FMRI Analysis Environment. Philosophy: Encompass all needed classes of data and computations


AFNI
E N D
Presentation Transcript
AFNI Robert W Cox, PhD National Institute of Mental Health Bethesda, MD http://afni.nimh.nih.gov/afni
An FMRI Analysis Environment • Philosophy: • Encompass all needed classes of data and computations • Extensibility + Openness + Scalability: Anticipating what will be needed to solve problems that have not yet been posed • Interactive vs. Batch operations: Stay close to data or view from a distance • Components: • Data Objects: Arrays of 3D arrays + auxiliary data • Data Viewers: Numbers, Graphs, Slices, Volumes • Data Processors: Plugins, Plugouts, Batch Programs
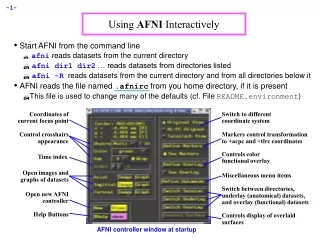
Steps in Processing with AFNI • Image assembly into datasets [to3d] • Can be done at scanner with realtime plugin • Image registration [3dvolreg] • Functional activation [AFNI, 3dfim] • Linear and nonlinear time series regression [3dDeconvolve, 3dNLfim] • Transformation to Talairach [AFNI] • Or: selection of anatomical ROIs [AFNI] • Integration of results across subjects [many] • Visualization & thinking [AFNI & you]
Interactive Analysis with AFNI Control Panel Displaying EP images from time series Graphing voxel time series data
Looking at the Results Multislice layouts FIM overlaid on SPGR, in Talairach coords
Sample Rendering: Coronal slice viewed from side; function not cut out Rendering is easy to setup and carry out from control panel
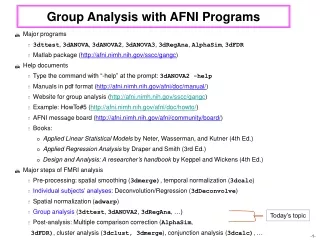
Integration of Results • Done with batch programs (usually in scripts) • 3dmerge: edit and combine 3D datasets • 3dttest: voxel-by-voxel t-tests • 3dANOVA: • Voxel-by-voxel: 1-, 2-, and 3-way layouts • Fixed and random effects • Other voxel-by-voxel statistics are available • 3dpc: principal components (space time) • ROI analyses are labor-intensive alternative
Extending AFNI Package • Batch programs • Output new 3D datasets for viewing with AFNI • Plugins — searched for & loaded at startup • Add interactive capabilities to AFNI program • “Fill in the blanks” menu for input from users • 40 page manual and some samples included • Plugouts — attach themselves during run • External programs that communicate with AFNI with shared memory or TCP/IP sockets
Whole Brain Realtime FMRI • Assembly of images into AFNI datasets during acquisition • Can use AFNI tools to visualize during scanning • Realtime 3D registration • Graph of estimated motion parameters • Recursive signal processing to update activation map with each new data volume • Color overlay changes with each TR
Realtime AFNI • AFNI software package has a realtime plugin, distributed with every copy • Price: USD$0 [except for time & effort] • Runs on Unix/Linux • Requires input of reconstructed images and geometrical information about them • For more information see Web site
The Goal: Interactive Functional Brain Mapping • See functional map as scanning proceeds 1 minute 2 minutes 3 minutes
Registration Goals for Online FMRI • Estimate 3D (6 DOF) movement parameters as fast as volume acquisition happens • Realign each volume to a “target” volume during scanning • Display updating graphs of estimated motions to investigator • Feedback movements to slice selection?
Estimated subject movement parameters
Multiple References • v(t) 1h1(t) + 2h2(t) + • 1 , 2 are amplitudes (unknown) • h1 , h2are known reference responses • Used for experiments with more than 1 stimulus condition: rest task A rest task B rest task A h1 0h2 0 h1 0 • Widely used for event-related FMRI
Linear Deconvolution • v(t) a + bt +jh(tj) + noise • j = stimulation times [known] • h(t) =k kuk(t) = response function • uk(t) = basis functions [known] • k= amplitudes [unknown] • Goal is to find shape and amplitude of response function in each voxel • Unlike previous analyses, form of response is not completely bound to hemodynamic assumptions
Recursive Linear Regression • All methods above can be cast into form of linear regression: • Solution of linear equations to get estimated fit parameters • Estimation of significance from noise model [i.e., using what’s left after regression fit] • Recursive regression: • With each new time point, add one equation • Given previous solution, can re-compute new fit with relatively little work (much less than starting over) • Method used in AFNI for realtime analysis
Nonlinear Regression orDeconvolution • v(t) a + bt +jh(tj) + noise • h(t) = h(t;) = nonlinearly dependent on • = vector of unknown parameters • Example: h(t) = A (t)r exp((t)/c) r=8.6 c=0.54 =0
Single Event FMRI:Use Nonlinear Regression? • In this type of experiment, the stimulus and its consequences last a long time • Only have one stimulus/response event per imaging run • Administration of a drug • Presentation of an affect altering video • Know when stimulus started, but don’t know exactly what response should be • Nonlinear curve fitting seems appropriate