Download
1 / 12
120 likes | 308 Vues
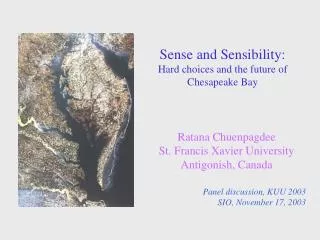
Sense and Sensibility: Hard choices and the future of Chesapeake Bay. Ratana Chuenpagdee St. Francis Xavier University Antigonish, Canada Panel discussion, KUU 2003 SIO, November 17, 2003. Chesapeake Bay is part of the US East Coast (North Carolina to Maine) itself part of FAO Area 21. .

E N D
Sense and Sensibility:Hard choices and the future of Chesapeake Bay Ratana Chuenpagdee St. Francis Xavier University Antigonish, Canada Panel discussion, KUU 2003 SIO, November 17, 2003
Chesapeake Bay is part of the US East Coast (North Carolina to Maine) itself part of FAO Area 21.
No break for Chesapeake Bay! • 2000 BC - Assumed its current shape; 1000 BC - Native Americans fished the Bay with spears, traps, and hooks & lines • 1607 – First permanent English settlement ; 1600s – Virginia enacted laws addressing fish wastes and blockage of fish migration by dams; 1750s – Colonists began using nets to catch fish • 1800s to now – Forest clearing, infrastructure development, new agricultural techniques, population boom, creation of suburbs, modern fishing methods;1813 – Oyster raking began. • 1900s to 1950s – Water quality survey; aerial photographs for submerged aquatic vegetation; Water pollution agencies established in Maryland and Virginia; 1950s – diseases (MSX and DEMO) killing oysters • 1967 to 1983 - Chesapeake Bay Foundation; Clean Water Act; Chesapeake Bay Program; 1983 – Bay resources identified as over-harvested; 1985 – Maryland Moratorium on striped bass fishing; 1989 – Virginia moratorium on striped bass fishing • 1995 – Striped bass stock restored; 1997 – Pfiesteria found in the Bay. • 2000 – Chesapeake Bay 2000 Agreement on habitat restoration and protection of marine living resources; 2002 – Report to Citizen on the state of the Bay; Ecosystem Management Plan.
Two analyses of the Chesapeake Bay ecosystem: • Using ‘fishing down marine food web’ to put Chesapeake Bay in the context of US east coast*; • Evaluating stakeholders’ preferences for various ecosystem scenarios, using ‘Ecopath with Ecosim’ and ‘damage schedule’ approach. * Collaboration with D. Pauly
Landings* from Chesapeake Bay and adjacent shelf waters, 1950 to 2000, shown for major trophic groups. Note the important role of menhaden, which has increased since 1950 in both relative and absolute terms. * Landings (commercial + recreational) from NMFS Annapolis Office, courtesy of D. Orner
The mean trophic levels* in Chesapeake Bay (blue), in US east coast (green), and in FAO Area 21 (purple) are converging toward the same low values. Chesapeake Bay led the way! * TL values from Hagy (2002) and FishBase.
A food web (Ecopath) model of Chesapeake Bay was used to generate (using Ecosim) several ecosystem scenarios, based on various management options, structured around different abundances of four major species (striped bass, menhaden, blue crab and oyster)* * Model and scenarios courtesy of V. Christensen and D. Priekshot
Ecosystem scenarios (EwE based) % Biomass change from 2000 level Striped bass Menhaden Blue crab Oyters + 25% + 100% + 25% + 900% + 25% + 200% n/c + 350% - 25% + 200% n/c + 350% -75% + 100% + 25% + 900% -75% + 100% n/c + 450% + 25% + 100% - 75% + 900% - 25% + 50% - 75% + 900% n/c -75% + 150% + 250% Biomass increase No change Biomass decrease Ecosystem management options Half double blue crab fishing rate, SAV* Half total fishing rate, no change to SAV Half menhaden fishing rate, no change to SAV Half half blue crab fishing rate, SAV Double half menhaden fishing rate, SAV Double double blue crab fishing rate, SAV Double blue crab fishing rate, no change to SAV Double total fishing rate, no change to SAV * SAV = Submerged aquatic vegetations
The damage schedule approach employs the paired comparison method to present items (here ecosystem scenarios) in pairs (discrete choice model). • A paired comparison questionnaire was sent to five stakeholder groups, i.e., watermen, seafood-related business people, conservation groups, scientists, and managers; • Respondents were asked to select, for each pair, which ecosystem scenario they preferred; • The responses were used to construct damage schedule (ranking) of the preferred scenarios, and thus preferred management options.
The Chesapeake Bay contains many kinds of fish and marine life. In your opinion, what possible combination of striped bass, menhaden, blue crab and oyster populations, presented below as Ecosystem A and B, would you prefer to see in the Chesapeake Bay? The increases or decreases in population are compared to current levels. Please circle only ONE letter, A or B, to indicate your choice. B A Population Population 25% Striped bass Striped bass 25% Menhaden Menhaden 150% 200% Blue crab Blue crab No change No change 350% 350% Oysters Oysters
Ecosystem scenarios (EwE based) % Biomass change from 2000 level Preference Striped bass Menhaden Blue crab Oyters score % Accept 70% + 25% + 100% + 25% + 900% 84 + 25% + 200% n/c + 350% 62 58% - 25% + 200% n/c + 350% 56 5% -75% + 100% + 25% + 900% 51 2% -75% + 100% n/c + 450% 31 5% + 25% + 100% - 75% + 900% 29 0% - 25% + 50% - 75% + 900% 18 n/c -75% + 150% + 250% 17 Biomass increase No change Biomass decrease Stakeholders’ preference for various ecosystem scenarios of the Chesapeake Bay, based on 45 respondents (5 watermen, 6 seafood businesspersons, 11 scientists, 12 managers, and 11 NGOs). Rankings obtained from these group were significantly correlated at alpha 0.01, suggesting strong agreement between groups. Ecosystem management options Half double blue crab fishing rate, SAV* Half total fishing rate, no change to SAV Half menhaden fishing rate, no change to SAV Half half blue crab fishing rate, SAV Double half menhaden fishing rate, SAV Double double blue crab fishing rate, SAV Double blue crab fishing rate, no change to SAV Double total fishing rate, no change to SAV * SAV = Submerged aquatic vegetations
What can the past inform the future of Chesapeake Bay? • Chesapeake Bay is leading a whole region on its way down; • High repair costs, low success; • Reactive policies are not sufficient; • Easy choices lead nowhere; • Hard policy options will have support from stakeholders, if they make sense and are made available; and • Implementing hard policy options requires courage. Thank you for your attention.