Aquatic Ecosystem Overview:
Aquatic Ecosystem Overview:. We need to understand the physical (e.g. hydrodynamics) and chemical environment that ultimately control the productivity, interactions, and evolution of life in aquatic ecosystems.

Aquatic Ecosystem Overview:
E N D
Presentation Transcript
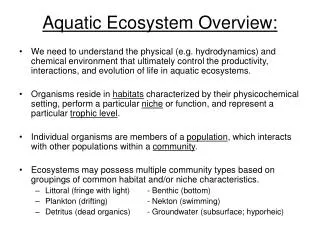
Aquatic Ecosystem Overview: • We need to understand the physical (e.g. hydrodynamics) and chemical environment that ultimately control the productivity, interactions, and evolution of life in aquatic ecosystems. • Organisms reside in habitats characterized by their physicochemical setting, perform a particular niche or function, and represent a particular trophic level. • Individual organisms are members of a population, which interacts with other populations within a community. • Ecosystems may possess multiple community types based on groupings of common habitat and/or niche characteristics. • Littoral (fringe with light) - Benthic (bottom) • Plankton (drifting) - Nekton (swimming) • Detritus (dead organics) - Groundwater (subsurface; hyporheic)
Temperate lake formed by geological faulting, depicted during the summer season. Density differences due to temperature result in stable layers, or strata. This process is called stratification. The Lake Example: Know your lake regions for benthic and open water habitats. Why the difference in O2 and CO2? (Cole, 1994; Fig 2.1)
Biological Productivity (Trophic Status) Volumetric units: mg C/m3/d Areal units: mg C/m2/d (Rawson Diagram): (Cole, 1994; Fig 1.1)
Productivity and Trophic Status • Ecosystem productivity is generally classified according to trophic states for convenience (see Dodds pp 337-341): • Oligotrophic (low) • Mesotrophic (medium) • Eutrophic (high) • These states represent ranges within a continuum of potential productivity within a system. • The impetus for identifying trophic state came from observations that certain biota (from algal to fish species) were often associated with specific nutrient levels. • Being able to classify systems is convenient for comparison of different areas as well as for defining management goals and reference points. • Trophic state is generally defined as a function of phytoplankton biomass / chlorophyll concentrations, nutrient concentrations, and/or water clarity.
Probability Distribution (Dodds, 2002; Fig. 17.2)
Fixed Boundary Classifications OECD = Organization for Economic Cooperation and Development Total P = phosphorous in dissolved and solid forms; inorganic and organic. Mean Chl = annual average of chlorophyll a. Mean Secchi = average depth to which a black and white disc can no longer be seen. (Dodds, 2002)
Continuous Value Scale (Carlson, 1977) (Dodds, 2002; Fig. 17.2)
Stream Ecosystems • Unless flow is slow enough, stream systems usually do not have a truly planktonic biomass of primary producers. Trophic state is measured by: • Attached benthic algae (periphyton) biomass • Nutrient (N & P) concentrations • Due to dependence of streams on terrestrial (allocthonous) organic matter, primary producers are not always a good indicator of system productivity.